Check San Diego Tap Water Safety: Verify Your ZIP Code’s 2026 Results
Yes. Based on the City of San Diego’s 2025 monitoring data, tap water throughout the city met every federal and California drinking water health standard. Some contaminants show up at trace, legal levels, and older household plumbing can still add lead the treatment plant never put there. San Diego tap water safety, in other words, checks out at the source; what happens between the meter and your faucet is worth a second look.
TL;DR:
- San Diego’s water treatment plants meet all federal and state safety standards, with no violations recorded in the 2025 monitoring report.
- Detection of contaminants like PFAS and lead are often at trace levels that do not pose health risks, especially since most lead issues stem from household plumbing.
- Older homes built before the mid-1980s may still have lead pipes or fittings, necessitating home testing and filtration for additional safety.
- Flushing taps and cleaning aerators regularly can help reduce household contaminants, and verified filters can target specific concerns like lead or PFAS.
- The city’s water is genuinely hard, with 16-18 grains per gallon, but this mineral content is not a health concern and mostly affects appliances and scale buildup.
Table of Contents
- San Diego Tap Water Safety: What the Official Reports Actually Show
- San Diego Water Contamination: What’s Detected vs. What’s Actually a Problem
- Where San Diego’s Water Comes From and How It Gets Treated
- What You Can Actually Do About Your Own Tap
- Cross-Checking the City’s PDF Against TapWaterIndex
- Why Local Verification Still Beats Blind Trust
- Look Up Your Own San Diego Water Data
- Sources
- FAQ
San Diego Tap Water Safety: What the Official Reports Actually Show
The city’s compliance record isn’t a marketing claim. It’s a documented outcome from testing required under the Safe Drinking Water Act and enforced by the California State Water Resources Control Board. The 2025 annual Drinking Water Quality Report lays out treatment performance, watershed sanitary surveys, and every monitored contaminant category, and it confirms no violations for the year.
If you want to check the numbers yourself instead of taking anyone’s word for it, here’s what to look for in the report:
- MCL (Maximum Contaminant Level): the legal ceiling for a given substance.
- 90th percentile: for lead, the value at or below which 90% of tested homes fell; this is the figure regulators actually use to judge compliance.
- RAA/LRAA: running annual average and locational running annual average, used for disinfection byproducts that fluctuate by season and location.
None of this requires a chemistry background. It requires knowing which three numbers matter, and now you do.
San Diego Water Contamination: What’s Detected vs. What’s Actually a Problem
“Detected” and “unsafe” are not the same word, and treating them as synonyms is where most water anxiety comes from. A lab that can find something at one part per trillion isn’t reporting danger. It’s reporting sensitivity.
PFAS get monitored across San Diego’s system, and detection at low levels doesn’t automatically mean an exceedance of any enforceable limit. The distinction between “present” and “over the line” matters more for PFAS than almost any other contaminant, because testing technology has gotten so precise it can find nearly anything somewhere.
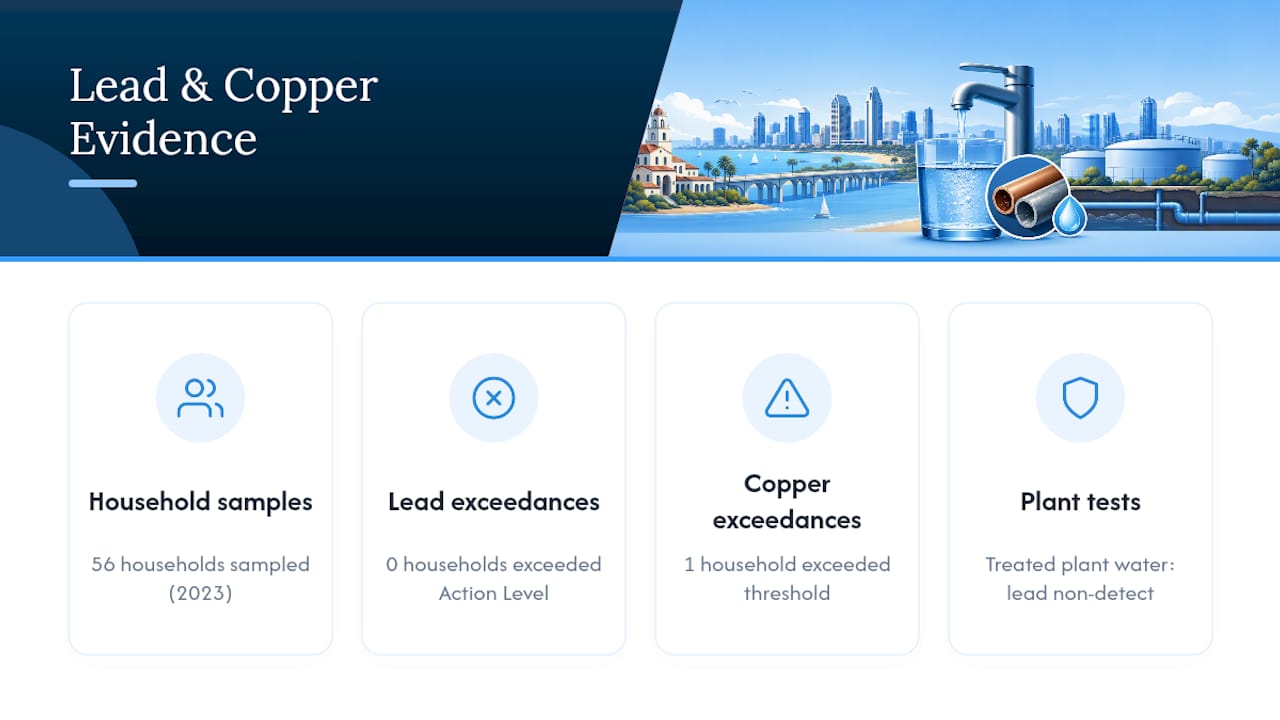
Lead and copper tell a more nuanced story. Water leaving San Diego’s treatment plants tested non-detectable for lead above the state’s detection limit, and system-wide sampling points to non-corrosive water chemistry, meaning the water itself isn’t aggressively pulling metal out of pipes. Of 56 households sampled in 2023, none exceeded the lead Action Level, though one copper result did. The gap between plant water and tap water is almost entirely about what’s inside your own walls.
Disinfection byproducts like TTHMs, bromate, and chlorite get tracked because disinfection itself, while essential, creates trace chemical byproducts. San Diego’s use of ozone at two treatment plants cuts down on some traditional byproducts while producing others, like bromate, that the city keeps below its regulatory average.
Taste and odor complaints, especially musty or earthy smells, usually trace back to geosmin, a compound produced by algae in open reservoirs. It’s unpleasant. It isn’t a safety issue, and a basic carbon filter clears it up.
Where San Diego’s Water Comes From and How It Gets Treated
San Diego blends imported water from Northern California and the Colorado River with local reservoir supplies, and the treatment process differs by plant. That variation is intentional, not a sign of inconsistency.
- Alvarado and Miramar treatment plants use ozone disinfection, which is effective against pathogens but generates bromate as a byproduct that requires its own monitoring.
- Otay treatment plant uses chlorine dioxide instead.
- Distribution system-wide, the city switches to chloramines to keep water stable as it travels through pipes to your home.
One number surprises a lot of new residents: San Diego water runs 16 to 18 grains per gallon of hardness, roughly 272 to 284 parts per million. That’s genuinely hard water. It’s a mineral and appliance issue, showing up as scale buildup and spotting on glassware, not a health hazard. If you’re shopping for a softener, be careful about over-softening the whole house. Stripping out too much mineral content can make water more corrosive, which works against the very lead protection the city’s water chemistry currently provides.
Fluoride sits at 0.7 parts per million, the level recommended for dental health benefits, and it’s added deliberately rather than occurring as contamination.
What You Can Actually Do About Your Own Tap
Here’s the honest version of the plumbing caveat: even with non-corrosive water leaving the treatment plant, any home built before the mid-1980s may still have lead solder, fittings, or service lines that can leach metal into standing water. That’s a household issue, not a citywide one, and it’s fixable once you know it’s there.
- Pull your ZIP code’s actual numbers. Check the city’s annual report or search your address through TapWaterIndex’s California lead dashboard to see supplier-level results instead of citywide averages.
- Test your home if it’s older or you’re unsure. Use a certified lab and follow proper cold-water sampling protocol rather than running the tap first, which can wash away the exact residue you’re testing for.
- Choose a filter certified for your actual concern. NSF/ANSI Standard 53 covers lead reduction; Standard 58 (reverse osmosis) is typically needed for PFAS. A pitcher filter certified for chlorine taste won’t touch either one.
- Flush stagnant water before drinking or cooking. If a tap hasn’t run in six or more hours, let cold water flow for a minute before using it, and always cook or drink from the cold line, not hot.
- Clean your aerators periodically. Sediment and scale collect there first, and it’s a five-minute fix.
- Call the Water Quality Hotline if you notice unusual color, smell, or pressure changes rather than guessing.
Pro Tip: Not every filter marketed for “contaminant reduction” removes PFAS. Check the box or the manufacturer’s site for NSF/ANSI 58 or 53 certification against the specific compound you’re worried about; a generic carbon filter can improve taste while doing nothing for PFAS or lead.
Cross-Checking the City’s PDF Against TapWaterIndex
City reports are thorough, but they’re also dense PDFs built for regulatory compliance, not quick reading. That’s the practical gap TapWaterIndex fills: it organizes the same EPA monitoring data by supplier, contaminant, and year, so you can filter straight to PFAS or lead results for your ZIP code instead of scanning forty pages.
A quick verification routine looks like this:
- Confirm the report states “no exceedances” for the most recent monitoring year.
- Check the 90th percentile lead figure against the Action Level, not just the plant’s raw result.
- Compare the same contaminant across both sources. If the city report and TapWaterIndex agree, you’ve got real confirmation, not a single source’s word.
Running both side by side takes maybe five minutes and gives you something rarer than reassurance: proof you checked.
Why Local Verification Still Beats Blind Trust
San Diego’s compliance record is real, and I trust monitoring data collected under enforceable federal rules more than I trust a viral post about “toxic tap water.” But compliance is a citywide average, and your kitchen isn’t the city. Household-level checks close that gap. One more thing worth knowing: the city has flagged scammers posing as water department employees at people’s doors, so route any real concern through the official hotline, not a stranger with a clipboard.
— Sergey
Look Up Your Own San Diego Water Data
Reading a forty-page PDF isn’t how most residents want to spend an evening, and that’s the gap TapWaterIndex was built to close. Instead of parsing dense compliance language, users can search by ZIP code or supplier to find EPA monitoring data organized by contaminant, including PFAS, lead, and disinfection byproducts.
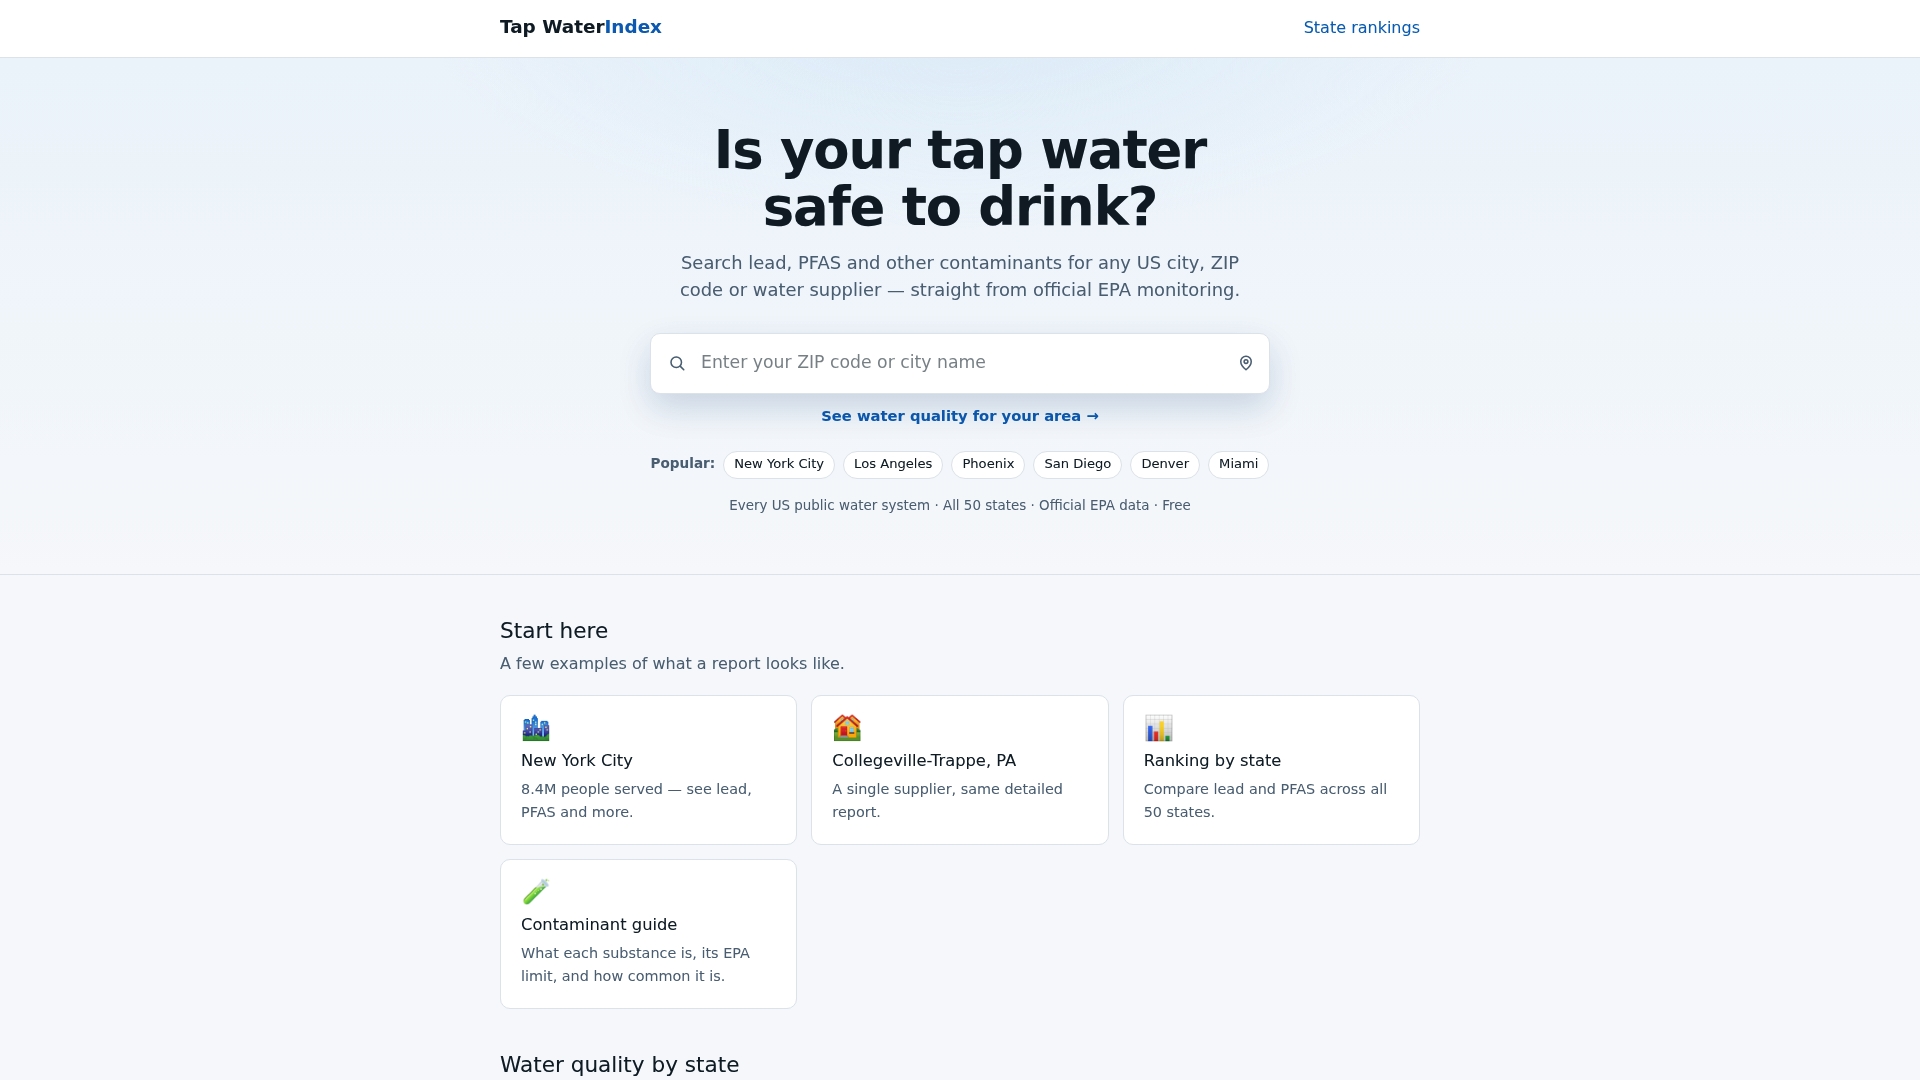
TapWaterIndex pulls from official EPA monitoring records the same way the city’s own report does, but it lets you compare San Diego’s numbers against other suppliers and states or dig into a specific compound through the contaminant explainer library if you want to understand what a given limit actually means. If lead is your main concern, the lead contaminant page breaks down the EPA limit and where it typically shows up nationwide. Search your San Diego ZIP code on TapWaterIndex now and see exactly what your supplier reported for the latest monitoring year.
This article is general information, not a substitute for advice from a qualified doctor. Consult a qualified healthcare professional about your own circumstances before acting on anything here.
Sources
- Water quality in your home or business | City of San Diego
- Water quality | San Diego County Water Authority
FAQ
Is it okay to drink tap water in San Diego?
Yes. City-wide monitoring for 2025 showed full compliance with federal and California drinking water standards, though residents with older plumbing should still watch for household-level lead risk.
What state in the US has the worst tap water?
Water quality varies by supplier rather than uniformly by state, since contamination often traces to specific local systems, aging infrastructure, or industrial sources rather than statewide conditions. Checking your exact supplier’s data matters more than any state-level generalization.
Which US state has the safest tap water?
There’s no single official ranking naming one state as definitively safest, because compliance depends on individual water systems, not state borders. Comparing supplier-level EPA data, available through resources like TapWaterIndex’s state rankings, gives a more accurate picture than a broad state label.
Is San Diego tap water safe to drink in 2026?
Based on the most recent monitoring data reported for 2025, yes. San Diego’s system met all state and federal health standards, and the 2025 annual report documents that compliance in detail.
Does San Diego tap water contain lead?
Water leaving the treatment plants tested non-detectable for lead, and system-wide sampling points to non-corrosive water chemistry. Any lead exposure risk typically comes from a home’s own pipes or fixtures, not the city’s water supply itself.