0.7 mg/L and Your Tap: Is Fluoride in U.S. Water Safe?

Yes, fluoride in tap water is safe at the recommended concentration of 0.7 mg/L, and it remains one of the most studied public-health interventions in the country. The main documented downside is dental fluorosis, a mostly cosmetic mottling of tooth enamel that shows up in young children who get too much fluoride before age 8. Checking your own tap’s level takes about five minutes.
TL;DR:
- Most U.S. community water systems aim for a fluoride level of 0.7 mg/L, balancing cavity prevention with minimal risk of dental fluorosis.
- Fluoridated water provides consistent topical exposure throughout the day, which is the main factor behind its cavity-fighting effectiveness.
- Exposure to fluoride from food, beverages, toothpaste, and saliva contributes significantly to overall intake, especially for children under 8.
- Over 62.9% of Americans on public water systems receive fluoridated water, while levels above 2.0 mg/L are rare and mainly found in private wells with high natural fluoride.
- Reliable methods like reverse osmosis and distillation are recommended for households needing to reduce fluoride levels, especially when testing confirms high natural fluoride.
Table of Contents
- What Fluoride Is and How It Prevents Tooth Decay
- What the Evidence Says: Benefits and Effectiveness
- Safety, Risks, and Regulatory Standards: The Levels That Matter
- Where Your Fluoride Exposure Actually Comes From
- How to Find Your Water’s Fluoride Level
- If You Want to Reduce or Remove Fluoride
- Common Concerns and Controversies: What the Science Actually Shows
- How Fluoridation Became Standard Practice
- What Opposition Groups Argue, and the Ethics Behind It
- How U.S. Fluoride Levels Compare to Other Countries
- Fluoride and Vulnerable Groups: Children, Pregnant Women, and Kidney Patients
- Where the Major Health Organizations Stand Today
- How Water Utilities Actually Add Fluoride
- Why Checking Your Own Tap Still Matters
- Check Your Own Tap’s Fluoride Level Right Now
- Sources
What Fluoride Is and How It Prevents Tooth Decay
Fluoride is a naturally occurring mineral, and most U.S. utilities that fluoridate their supply add it in the form of fluorosilicic acid, sodium fluoride, or sodium fluorosilicate. These compounds dissolve completely in water and behave identically once mixed in, regardless of which one a utility chooses. The additive itself isn’t the story. The concentration is.
The mechanism is worth understanding because it explains why such a tiny amount does so much work. Tooth enamel is made largely of a mineral called hydroxyapatite, which acid from food, bacteria, and plaque slowly dissolves over the course of a day. When fluoride ions are present in saliva, they help rebuild that mineral into a tougher, more acid-resistant version called fluorapatite. This process, called remineralization, happens continuously in your mouth every time you drink fluoridated water, brush your teeth, or eat something processed with fluoridated tap water.
That’s the key distinction dentists make: topical exposure versus systemic exposure. Topical exposure means fluoride sits on the tooth surface and interacts directly with enamel. This is where nearly all the cavity-fighting benefit happens. Systemic exposure means fluoride gets absorbed into the bloodstream and eventually into developing teeth before they even erupt, which is a smaller part of the benefit and where most of the risk conversation lives.
Community water fluoridation is effective largely because it delivers frequent, low-dose topical exposure. You’re not getting one big dose. You’re getting small amounts many times a day, every time you fill a glass, brush with tap water, cook pasta, or drink coffee. That repetition matters more than the size of any single dose. A fluoride mouth rinse or a dental varnish delivers a much higher concentration but only occasionally. Fluoridated water delivers a modest concentration constantly, and constancy is what rebuilds enamel over time.
Here’s how the exposure pathway typically breaks down for someone drinking fluoridated tap water throughout the day:
- Direct drinking water: the most consistent and predictable source, calibrated by the utility to the 0.7 mg/L target
- Beverages and food prepared with tap water: soups, coffee, tea, and reconstituted juice all pick up the local fluoride level
- Toothpaste and mouth rinses: a concentrated topical source used briefly, not swallowed in meaningful amounts
- Saliva after eating: fluoride already absorbed into saliva continues bathing teeth between direct water contact
- Incidental ingestion in children: young kids swallow more toothpaste than adults, which is why pediatric dosing on toothpaste labels matters
The U.S. Public Health Service set 0.7 mg/L as the optimal concentration specifically because it’s the point where the curve flattens: below it, cavity protection drops off meaningfully, and above it, the added protection is marginal while fluorosis risk in young children starts climbing. That number isn’t arbitrary. It’s the product of decades of dose-response research trying to find the exact concentration where benefit is maximized and risk stays low. Utilities that fluoridate calibrate to hit that target, not to maximize fluoride content, which is a distinction that gets lost in a lot of the public debate.
What the Evidence Says: Benefits and Effectiveness
Community water fluoridation reduces tooth decay by about 25% in children and adults, according to systematic reviews the CDC relies on for its own guidance.
That figure comes from decades of comparative data between fluoridated and non-fluoridated communities, and it’s held up remarkably well across different study designs, populations, and time periods. The CDC’s own scientific statement on community water fluoridation describes it as a safe, cost-effective measure, and that conclusion draws on expert panel reviews rather than a single study.
The original evidence for fluoridation’s effectiveness came from a natural experiment. In 1945, Grand Rapids, Michigan became the first U.S. city to fluoridate its public water supply, and researchers tracked cavity rates in local schoolchildren for years afterward against comparison cities that hadn’t fluoridated. The drop in decay rates was large enough, and consistent enough across follow-up studies in other cities, that public health agencies moved from cautious optimism to firm endorsement within about a decade.
What’s easy to miss is that the benefit isn’t limited to children. Adults who grew up drinking fluoridated water tend to keep more of their natural teeth into old age, and adults living in fluoridated communities now see reduced rates of root decay and tooth loss compared to those without fluoridated tap water. Fluoridation protects teeth at every stage of life, not just during the years enamel is forming.
The economic case tracks the health case closely:
- Every dollar invested in community water fluoridation saves substantially more in avoided dental treatment costs, since fixing a cavity is always more expensive than preventing one
- Communities that stop fluoridating and later reinstate it typically see cavity rates climb during the gap, then fall again after fluoridation resumes, which is about as close to a controlled experiment as public health gets
- Low-income households, which have less consistent access to dental care, see disproportionately large benefits from water fluoridation because it doesn’t require a dentist visit, insurance, or even remembering to buy fluoride toothpaste
- Rural and underserved communities often depend on water fluoridation as their most reliable source of preventive dental care
As of 2020, roughly [62.9% of the U.S. population had access to a fluoridated community water system](https://pmc.ncbi.nlm.nih.gov/articles/PMC10706776/). That means more than a third of the country either lives somewhere that doesn’t fluoridate, relies on a private well, or drinks water with naturally variable fluoride content. That gap explains a lot of the regional confusion around fluoride: two people in neighboring towns can have completely different fluoride exposure without either of them ever adjusting their diet or dental habits. It’s also why checking your specific supplier’s data matters more than assuming a national average applies to your glass of water.
Safety, Risks, and Regulatory Standards: The Levels That Matter
Three numbers govern this entire topic, and confusing them is where most fluoride anxiety comes from.
The first is 0.7 mg/L, the U.S. Public Health Service recommended optimal level for cavity prevention. Utilities that fluoridate deliberately aim for this concentration. It replaced an older range of 0.7 to 1.2 mg/L in 2015, after regulators concluded that people now get fluoride from more sources than they did decades ago (think fluoride toothpaste, which barely existed as a mass product in the 1940s) and that a single, lower target better balanced benefit against fluorosis risk.
The second and third numbers come from the EPA rather than the CDC: a secondary maximum contaminant level (SMCL) of 2.0 mg/L, meant to limit the risk of dental fluorosis, and an enforceable maximum contaminant level (MCL) of 4.0 mg/L, which is the health-based ceiling meant to prevent skeletal fluorosis from long-term high exposure. The MCL was set in 1986 and has faced periodic scientific review since, including recent litigation and regulatory attention around neurodevelopmental research at high exposure levels, though the enforceable limit itself has not changed.
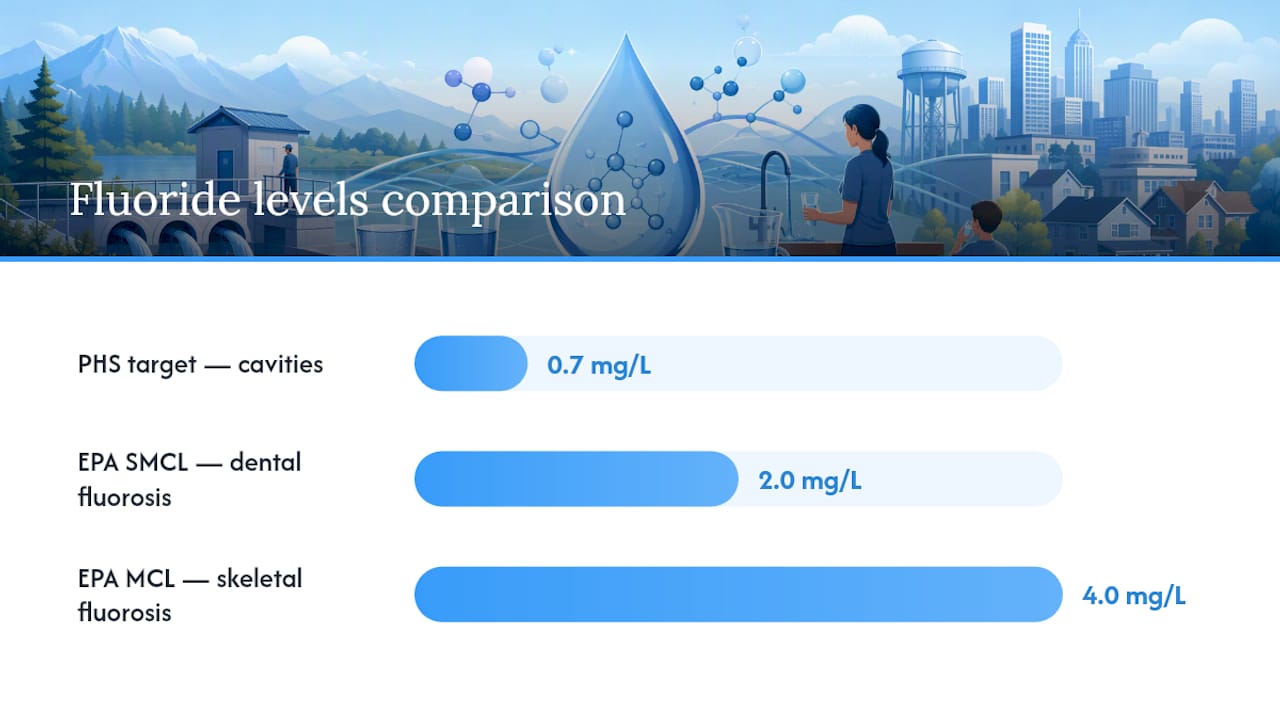
CDC surveillance data from 2016 to 2021 found that most fluoridated systems operate comfortably between 0.6 and 2.0 mg/L, with only about 0.01% of person-months exceeding the 2.0 mg/L secondary standard. In plain terms, U.S. utilities that fluoridate almost never overshoot the target by any meaningful margin, and the systems that do tend to be small ones drawing on naturally high-fluoride groundwater rather than over-adding fluoride deliberately.
The documented health effects at these levels are narrower than public debate suggests. Dental fluorosis is the primary risk, and in the U.S. it’s overwhelmingly mild: faint white streaks or spots on enamel that are often invisible without close dental examination. It happens when children under 8, whose adult teeth are still forming under the gumline, take in more fluoride than their developing enamel can handle. It’s cosmetic, not structural, and it doesn’t affect tooth function.
Skeletal fluorosis, which affects bones rather than teeth, is a different and far more serious condition. It requires very high chronic exposure over years, generally well above anything seen in U.S. municipal water, and it’s essentially unheard of in American communities with fluoridated supplies. It shows up in parts of the world where natural groundwater fluoride runs many times higher than any U.S. regulatory limit.
No credible body of evidence ties fluoride at recommended U.S. levels to cancer, heart disease, or other major systemic illness. If you want a practical action threshold: if your utility’s fluoride level runs at or near the 0.7 mg/L target, there’s nothing to act on. If you’re on a private well or your Consumer Confidence Report shows levels above 2.0 mg/L, that’s worth a call to your local health department or a conversation with your dentist about fluorosis risk for young children in the household.
Where Your Fluoride Exposure Actually Comes From
Tap water is one source among several, and that matters because the safety math is about total intake, not just what comes out of your faucet.
Most people get fluoride from a combination of these sources:
- Fluoridated tap water, consumed directly and used in cooking
- Processed beverages and foods made with fluoridated water, including sodas, juices, soups, and infant formula mixed at home
- Toothpaste and mouth rinses, which deliver a concentrated topical dose, some of which young children inevitably swallow
- Certain bottled waters, which vary widely, some fluoridated to match tap levels and others essentially fluoride-free
- Fluoride supplements, prescribed in rare cases for children in non-fluoridated areas at high cavity risk
- Naturally occurring fluoride in some well water and food, particularly tea and certain seafood
NIH’s Office of Dietary Supplements notes that municipal water and the foods and drinks prepared with it account for most people’s fluoride intake, which is exactly why the 0.7 mg/L target accounts for these other sources rather than assuming water is the only exposure route.
Age drives vulnerability here more than anything else. Children under 8 are the group public-health guidance focuses on, because that’s the window when permanent teeth are still mineralizing beneath the gumline. A child who regularly swallows fluoride toothpaste, drinks fluoridated tap water, and eats foods made with it can stack multiple sources during exactly the years fluorosis risk is highest. Adults don’t face this window; their enamel is already fully formed, so extra fluoride exposure doesn’t carry the same cosmetic risk.
Pro Tip: Use a pea-sized amount of toothpaste for kids under 6, supervise spitting instead of swallowing, and skip fluoride mouth rinse for children under age 6 unless a dentist recommends it. That single habit change addresses more of a young child’s fluoride exposure than adjusting your tap water ever will.
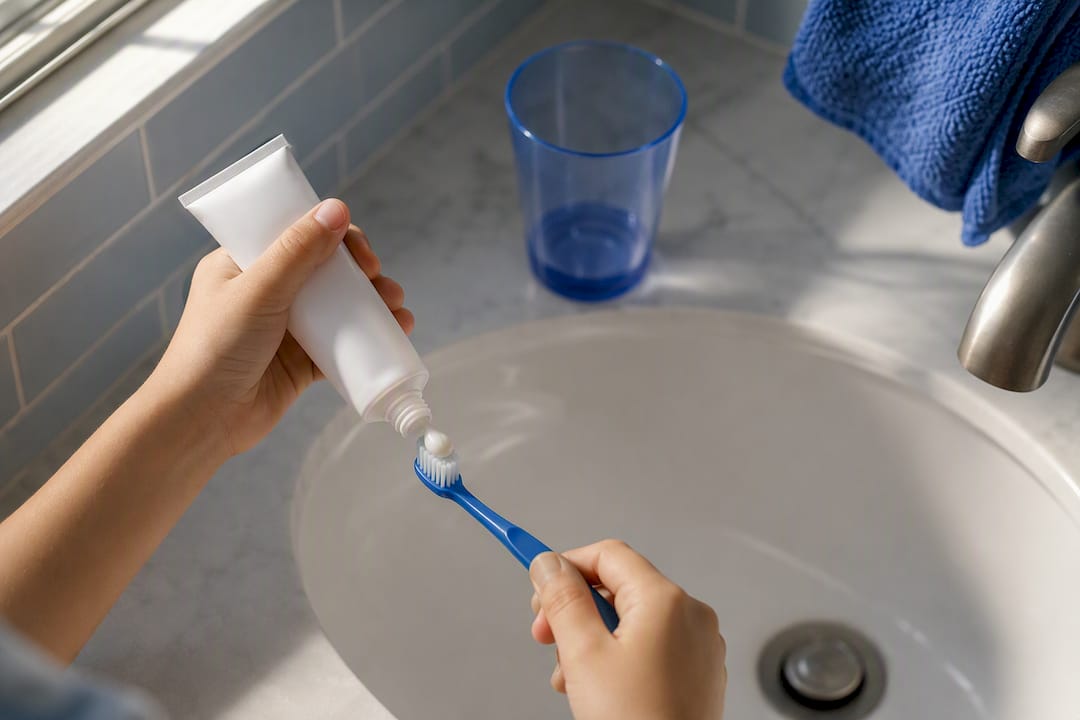
If you’re trying to estimate your household’s total exposure, start with your water utility’s reported level, then talk to your pediatric dentist about toothpaste habits and whether supplements make sense. That conversation is more useful than trying to calculate milligrams yourself.
How to Find Your Water’s Fluoride Level
Figuring out what’s actually coming out of your tap takes four steps, and most people can finish all of them in under fifteen minutes.
-
Check your water utility’s Consumer Confidence Report first. Every public water system is required to publish an annual report, usually available on the utility’s website or by request, that lists fluoride and other measured contaminants for the past year. This is the single most authoritative number you can get, because it comes directly from the entity treating your water.
-
Search CDC’s My Water’s Fluoride for a secondary check. CDC’s My Water’s Fluoride tool lets you look up fluoridation status by state and system, but treat it as a starting point rather than gospel. It depends on voluntary state reporting, which means some entries lag behind current conditions or reflect data submitted years earlier. The local water utility remains the definitive source for your current tap fluoride level, not the database.
-
If you’re on a private well, skip the databases entirely and get it tested. Private wells aren’t regulated the way public systems are, and fluoride levels in groundwater can vary sharply even between neighboring properties. Your state’s public health lab or an accredited environmental testing lab can run a fluoride analysis, typically for a modest fee, and that’s the only reliable way to know what’s actually in your well water.
-
Use TapWaterIndex to cross-check your utility’s full contaminant picture. Beyond fluoride alone, TapWaterIndex’s searchable database lets you pull EPA-based reports by city, ZIP code, or specific supplier, so you can see fluoride levels alongside lead, PFAS, and other regulated contaminants in one place instead of hunting through separate reports.
Once you have your number, the interpretation is simple: near 0.7 mg/L means your utility is fluoridating to the recommended target. Zero or near-zero means you’re in a non-fluoridated area. Above 2.0 mg/L, especially on a private well, is worth a follow-up call to your local or state environmental health office.
If You Want to Reduce or Remove Fluoride
Some households have legitimate reasons to lower fluoride intake, most commonly parents mixing infant formula with tap water or people on private wells with naturally high levels above 2.0 mg/L.
Not every filter does this job, and that distinction trips people up constantly:
- Reverse osmosis systems reliably reduce fluoride, typically removing the large majority of it, and they’re the most consistently recommended household option
- Distillation also removes fluoride effectively, since the process leaves dissolved minerals behind when water evaporates and recondenses
- Activated alumina filters are specifically designed to target fluoride and work well, though they’re less common in standard retail filter products
- Standard activated carbon filters, the kind built into most pitcher filters and refrigerator dispensers, generally do not remove fluoride effectively, even though they handle chlorine taste and some organic compounds well
Independent testing consistently shows that reverse osmosis and distillation are the reliable options, while carbon alone leaves fluoride largely untouched. That’s worth knowing before you spend money assuming any water filter handles the job.
Cost and maintenance vary a lot between these options. Reverse osmosis systems run from budget under-sink units to pricier whole-house setups, and they require periodic membrane replacement plus they waste some water in the filtration process. Distillers use more electricity and are slower, producing water a batch at a time rather than continuously. Both methods also strip beneficial minerals along with fluoride, which isn’t dangerous but is worth knowing if you’re relying on tap water as a mineral source.
Pro Tip: If your only concern is infant formula and your well or utility tests above 2.0 mg/L, ask your pediatrician about using low-fluoride bottled water just for formula prep rather than overhauling your entire home’s water treatment.
Removal makes sense when testing confirms levels meaningfully above the 2.0 mg/L secondary standard, particularly for households mixing infant formula daily. It’s generally not necessary, and arguably counterproductive, for households sitting at or near the 0.7 mg/L optimal target.
Common Concerns and Controversies: What the Science Actually Shows
Fluoride generates more organized opposition than almost any other water additive, and some of the concerns deserve a straight answer rather than dismissal.
The most persistent claims involve cancer, neurodevelopmental effects, and endocrine disruption. Major reviews, including the ones underlying CDC’s ongoing safety statement, find no credible link between fluoride at the recommended 0.7 mg/L and cancer, heart disease, or Alzheimer’s disease. That conclusion isn’t a dismissal of the studies opponents cite. It’s a reflection of what those studies actually measured.
Here’s where the disconnect usually happens:
- Many of the studies cited by fluoridation opponents involve exposure levels several times higher than anything found in U.S. fluoridated water, often from regions with naturally high groundwater fluoride
- Several rely on ecological study designs, which compare population-level outcomes across regions rather than tracking individual exposure and health, making it hard to rule out confounding factors like diet, income, or other environmental exposures
- Neurodevelopmental research getting attention in ongoing regulatory review generally involves exposure ranges above the U.S. optimal target, not at it, which matters enormously when translating findings into policy for a system running at 0.7 mg/L
None of this means the science is closed forever. Regulatory review of the fluoride MCL is active, and that’s a normal, healthy part of how public health standards get periodically re-examined as new research accumulates. If you want to evaluate a specific claim you’ve encountered, check whether the underlying study measured exposure anywhere close to 0.7 mg/L, and look for whether major panels like CDC, ADA, or NIH have weighed in on that specific research, rather than taking a single study’s conclusion at face value.
How Fluoridation Became Standard Practice
Water fluoridation started as a scientific puzzle, not a policy initiative. In the early 1900s, dentists in Colorado Springs noticed unusual brown staining on some residents’ teeth, later traced to naturally high fluoride in the local groundwater. Researchers studying that staining also noticed something else: those same residents had noticeably fewer cavities.
That observation launched decades of research trying to find a concentration that delivered the cavity protection without the staining. Grand Rapids, Michigan settled on 1.0 mg/L as its target and became the first U.S. city to deliberately fluoridate its public water supply in 1945, treating the move as a large-scale public health experiment with rigorous before-and-after tracking of children’s dental health.
The results were persuasive enough that fluoridation spread to other American cities within a decade, and professional endorsement followed from national dental and medical organizations as the evidence accumulated. By the second half of the twentieth century, community water fluoridation had become one of the most widely implemented preventive health measures in the country, credited by health agencies as a major factor behind the decline in childhood cavities over that period. The recommended target has been refined since (most notably the 2015 shift to the single 0.7 mg/L standard), but the basic strategy traces directly back to that Colorado Springs observation.
What Opposition Groups Argue, and the Ethics Behind It
Opposition to water fluoridation isn’t a fringe position confined to one political direction. It draws critics across the spectrum, and their arguments generally fall into a few consistent categories worth taking seriously even if the underlying science doesn’t support all of them.
The most common objection is about consent and medical autonomy: adding a substance to a shared water supply means individuals can’t opt out the way they could with a fluoride toothpaste or supplement they choose to buy. Critics argue this amounts to mass medication without individual consultation, regardless of how safe the substance is at the dosed level.
A related argument concerns dosage control. Someone drinking six glasses of water a day gets a very different total fluoride dose than someone drinking two, and water fluoridation can’t account for that variation the way a personally chosen dental product can.
Some opposition also centers on distrust of the additives themselves, particularly fluorosilicic acid, which is often industrially sourced rather than pharmaceutical grade, even though regulatory testing confirms it meets drinking water safety standards once diluted to the target concentration.
These arguments are worth engaging with directly rather than waving away, even where the safety evidence at 0.7 mg/L remains strong. The ethical debate about population-wide interventions is separate from the toxicology debate, and treating them as the same conversation tends to shut down productive discussion on both sides.
How U.S. Fluoride Levels Compare to Other Countries
The United States sits in the middle of a wide global range on this issue. Roughly 62.9% of Americans on public water systems receive fluoridated water targeted at 0.7 mg/L, putting the country among the more consistent fluoridators worldwide.
Several other nations, including Canada, Australia, Ireland, and parts of the United Kingdom, run comparable community fluoridation programs at similar target concentrations, generally in the 0.6 to 1.0 mg/L range. Most of continental Europe, by contrast, has moved away from water fluoridation entirely, relying instead on fluoridated salt, fluoridated milk programs, or fluoride toothpaste as the primary delivery method. That’s a policy choice rather than a safety verdict. Countries like Germany, France, and Switzerland made this shift decades ago partly over the same consent arguments raised domestically, not because of documented harm at the levels being used.
At the other extreme, some regions of India, parts of East Africa, and areas of northern China have naturally occurring fluoride in groundwater running many times higher than any deliberate fluoridation target, sometimes exceeding 10 mg/L, and it’s in these high, uncontrolled exposure zones that skeletal fluorosis and severe dental fluorosis actually show up in meaningful numbers. That distinction, between a deliberately dosed 0.7 mg/L and an uncontrolled natural exposure of 10 mg/L or more, gets lost whenever international fluorosis statistics get cited in the U.S. fluoridation debate.
Fluoride and Vulnerable Groups: Children, Pregnant Women, and Kidney Patients
Children under 8 remain the population public-health guidance is built around, since their permanent teeth are still forming and excess fluoride during that window is what causes dental fluorosis. The 0.7 mg/L target already accounts for this sensitivity, but households mixing infant formula with tap water carry the highest concentrated exposure risk for this age group, since formula becomes a baby’s near-total fluid intake.
Pregnant women don’t face the same fluorosis risk, since a developing fetus’s teeth aren’t yet exposed to fluoride the way a young child’s erupting teeth are, and major reviews haven’t found reliable evidence connecting fluoridated water at 0.7 mg/L to pregnancy complications. Some neurodevelopmental research getting regulatory attention has examined prenatal exposure, but again generally at levels above the U.S. optimal target rather than at it.
People with significant kidney impairment process fluoride differently than the general population, since healthy kidneys clear excess fluoride efficiently through urine. Reduced kidney function means fluoride can stay in the body longer, and some clinicians recommend that patients with advanced kidney disease discuss fluoride intake, including from water and supplements, with their nephrologist. This is a case where a household member’s specific medical situation, not the general population standard, should guide the conversation.
Where the Major Health Organizations Stand Today
The scientific consensus among major health bodies hasn’t shifted from its core position in decades, even as individual studies and regulatory reviews continue.
The World Health Organization considers water fluoridation an effective, safe public health measure where implemented at appropriate levels, and it’s included fluoride guidance in its drinking water quality standards for years. The CDC has repeatedly named community water fluoridation one of the most significant public health achievements of the past century, a designation it hasn’t walked back despite ongoing MCL review. The American Dental Association continues to endorse fluoridation at the 0.7 mg/L target as safe and effective for cavity prevention across all age groups.
What’s notable is that none of these organizations claim the topic is scientifically closed to further study. Regulatory review of the fluoride MCL is active, and updated research on neurodevelopmental effects at higher exposure levels is being incorporated into that review process. Consensus doesn’t mean no one is still looking. It means the accumulated body of evidence at the recommended concentration continues to support the same conclusion it has for decades, even as scrutiny continues at the margins.
How Water Utilities Actually Add Fluoride
Fluoridating a municipal water supply is a metering process, not a rough estimate. Utilities use one of three common additives: fluorosilicic acid (a liquid, most common in larger systems), sodium fluoride (a dry powder, more common in smaller systems), or sodium fluorosilicate (also a dry powder). All three dissolve completely and behave identically in water once mixed, so the choice mostly comes down to a system’s size, budget, and existing feed equipment.
The actual dosing happens through automated chemical feed systems that inject a precisely calibrated amount of the additive into the water stream as it flows through the treatment plant, calculated to hit the 0.7 mg/L target based on the plant’s flow rate. Operators run regular water quality tests, often daily, to confirm the concentration is landing where it should and to catch and correct any equipment drift before it becomes a meaningful deviation.
This isn’t a set-it-and-forget-it system. Feed equipment gets inspected, calibrated, and maintained on a schedule, and the CDC’s own surveillance data confirms the process works as intended across the vast majority of systems, with the overwhelming majority of fluoridated systems staying within their target range year after year.
Why Checking Your Own Tap Still Matters
Publishing this kind of breakdown always risks making fluoride sound like a settled, uniform fact, and that’s exactly the wrong takeaway. It isn’t uniform. It varies by utility, by state, by whether you’re on a well, and even by season in some smaller systems drawing on groundwater sources that fluctuate naturally.
TapWaterIndex builds its reports directly from official EPA monitoring data specifically because national averages and advocacy talking points, on either side of this debate, tend to flatten that variation into something simpler than reality. A city three miles from yours can run a meaningfully different fluoride level, and you won’t know that from a Facebook post or a national news segment. Search your city, ZIP code, or supplier before you assume anything about your own glass of water, and don’t change your household’s habits based on what you read here or anywhere else without confirming your actual local number first.
If you’re a parent of a child under 8, that verification matters even more. Loop in your pediatric dentist once you know your local level, especially if you’re also using fluoride supplements or a well. The data answers the “what’s in my water” question. A dentist or doctor is still the right call for the “what should my family do about it” question.
— Sergey
Check Your Own Tap’s Fluoride Level Right Now
Reading about national averages only gets you so far when your own water supplier might run meaningfully different numbers. Some online platforms pull directly from EPA monitoring data to show fluoride levels, along with lead, PFAS, and other regulated contaminants, for specific cities, ZIP codes, or water suppliers, so you can work with actual local reports instead of national estimates.
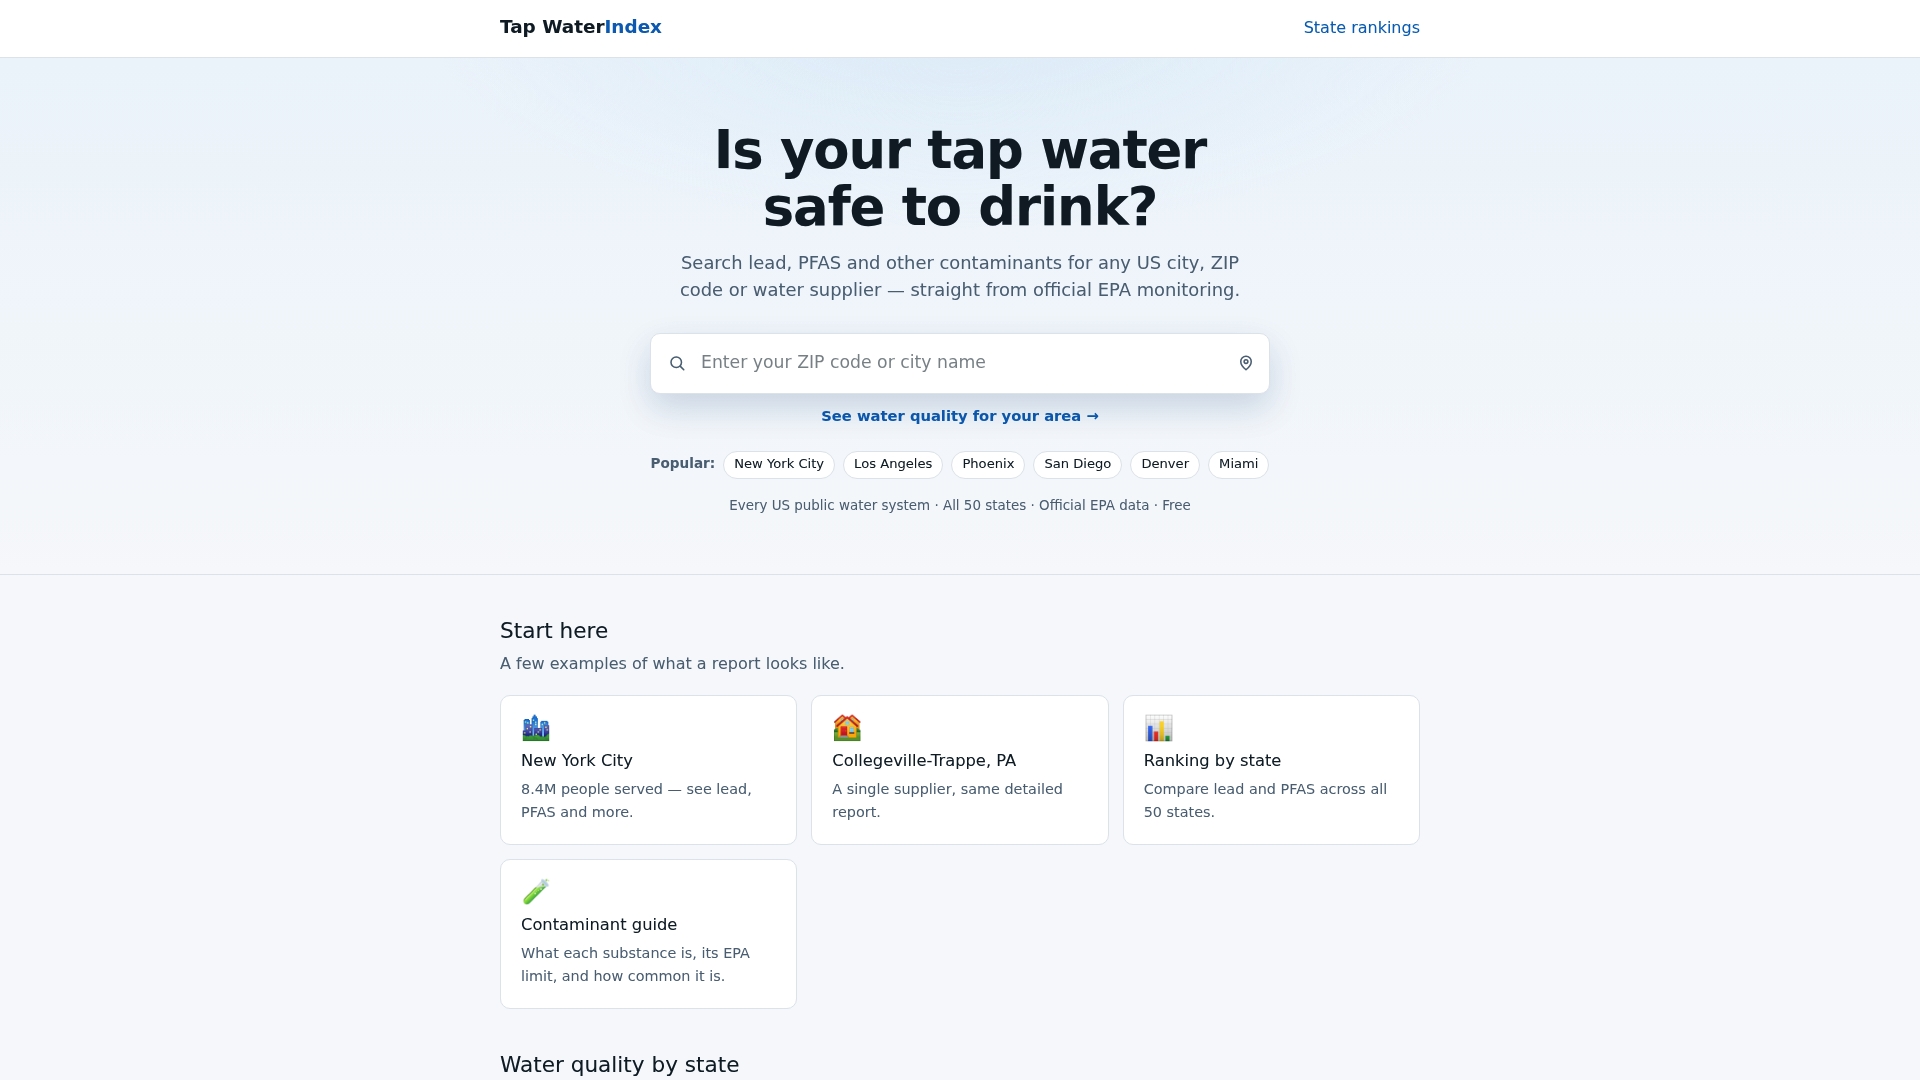
Search your address on the TapWaterIndex homepage to pull up your supplier’s current data, or head to the state-by-state rankings if you want to see how your entire state compares on fluoride and other contaminants before you dig into your specific system. Either way, you’ll walk away with the actual number for your tap, not a guess based on where you think you fall on a national curve.
This article is general information, not a substitute for advice from a qualified doctor. Consult a qualified healthcare professional about your own circumstances before acting on anything here.
Sources
- CDC: U.S. Public Health Service recommendation for fluoride concentration
- EPA: Fluoride in drinking water
- Community water fluoridation access data (PMC)
- CDC My Water’s Fluoride (MWF)