Turbidity in Drinking Water: What the Cloudiness Means
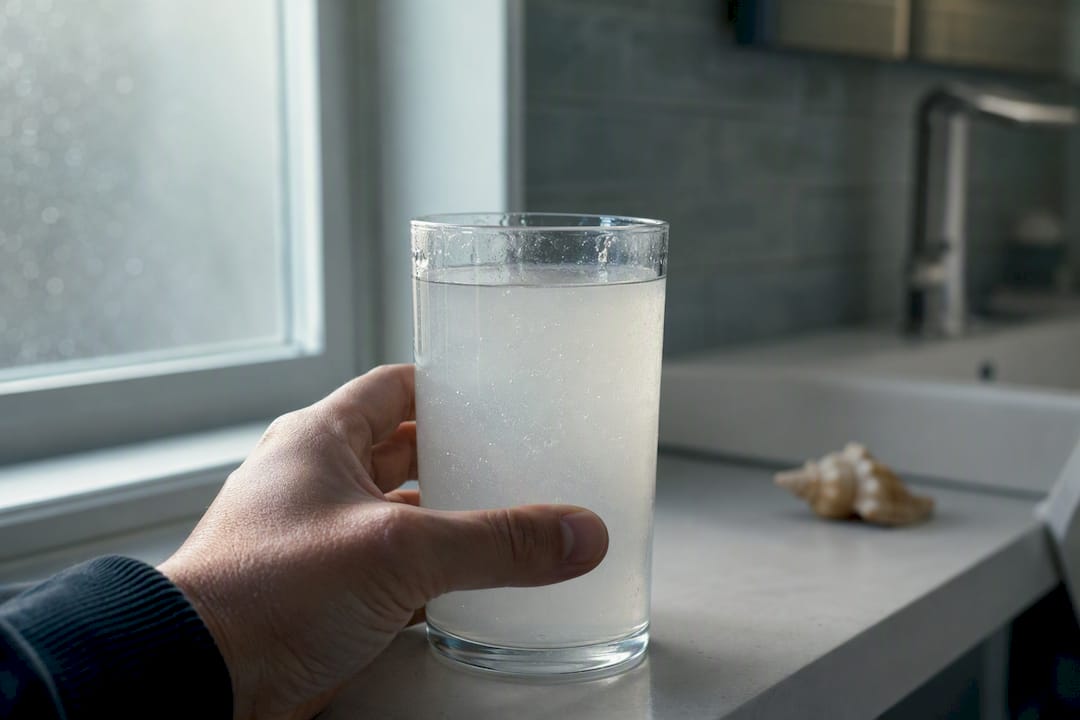
Turbidity measures how much suspended material scatters light in water, and it’s reported in Nephelometric Turbidity Units, or NTU. The World Health Organization and EPA both treat it as an early-warning signal for treatment performance, not a direct safety test. Most utilities aim for treated water at or below 0.1 NTU, and regulatory frameworks generally require staying under a low single-digit NTU value, where filtration isn’t otherwise mandated.
A high reading can mean a filter is failing or sediment got stirred up in the pipes, and either scenario can let pathogens slip past disinfection. A low reading doesn’t guarantee sterile water. Turbidity tells you something changed. It doesn’t tell you what.
If your water looks cloudy right now:
- Check your utility’s most recent turbidity data or annual water quality report.
- Call your water supplier and ask if they’ve issued any recent advisories.
- If a boil-water notice is active, follow it before drinking or cooking with tap water.
Target range: Treated drinking water should generally run ≤0.1 NTU, with most regulations drawing a hard line at 1.0 NTU for systems that filter.
Key Takeaways
Turbidity is an optical measure of light scattering that signals treatment or distribution problems in drinking water long before other tests catch them.
| Point | Details |
|---|---|
| Know the target | Treated water should generally stay ≤0.1 NTU, with 1.0 NTU as a common regulatory ceiling. |
| Turbidity isn’t a safety verdict | High or low readings alone don’t confirm pathogen presence; microbial testing is still required. |
| Watch for spikes, not just limits | A jump of 50% or more above baseline often signals filter or process trouble even under the legal limit. |
| Match your response to the cause | Boil-water notices, point-of-use filters, or a call to your utility depend on what triggered the reading. |
| Verify with official data | Tapwaterindex turns EPA monitoring records into searchable reports by city, ZIP, or supplier. |
Table of Contents
- What Turbidity Actually Measures and What Causes It
- How Turbidity Gets Measured: Nephelometry, NTU, and ISO 7027
- Does Turbidity Mean Your Water Is Unsafe?
- How Water Systems Remove Turbidity (and What You Can Do)
- Getting Turbidity Sampling and QA/QC Right
- Where to Verify Your Local Turbidity and Water Quality Data
- Why This Number Matters More Than People Assume
- Check Your Local Water Quality Data Now
- Frequently Asked Questions
- Sources
What Turbidity Actually Measures and What Causes It
Turbidity isn’t a count of particles or a weight measurement. It’s optical: a beam of light hits the water, suspended material scatters that light, and a sensor reads how much bounces back at a specific angle. That’s fundamentally different from total suspended solids (TSS), which measures the dry mass of particles filtered from a sample, or true color, which comes from dissolved substances like tannins rather than anything floating in the water.
Cloudy tap water traces back to a handful of usual suspects:
- Silt and clay washed in after heavy rain or runoff
- Decaying organic matter and algae in the source water
- Iron or manganese precipitates forming inside pipes
- Biofilms or sediment disturbed during distribution-system work
- Plankton blooms in reservoirs or open surface sources
Surface water sources and groundwater under the direct influence of surface water tend to see more turbidity swings than deep, protected groundwater wells. That’s part of why private well owners face a different set of concerns than someone on a municipal system, something we’ll get to.
Pro Tip: Two water samples with identical particle mass can produce very different NTU readings. Particle size, shape, and refractive index all bend and scatter light differently, which is why comparing turbidity numbers across labs or instruments without matched calibration standards can be misleading.
How Turbidity Gets Measured: Nephelometry, NTU, and ISO 7027
The industry standard method is nephelometry: a light source shines through the sample, and a detector positioned at 90 degrees measures scattered light. This geometry is reliable across an enormous range, from under 0.05 NTU up to more than 1,000 NTU, which is why it’s the default approach for both pristine drinking water and heavily loaded process water.
Instruments get calibrated against Formazin, a synthetic polymer suspension that serves as the primary reference standard worldwide. Labs and treatment plants also use certified secondary standards for day-to-day checks, saving the primary Formazin prep for periodic verification.
ISO 7027 specifies nephelometry as the method for low-turbidity waters like drinking water, and turbidimetry for higher-turbidity applications such as wastewater. Under this standard, NTU and FNU values are numerically equivalent, which resolves a lot of confusion when comparing instruments that report in different unit names.
Field crews and lab technicians deal with the same recurring headaches: trapped air bubbles inflate readings, sample agitation before measurement skews results, and colored dissolved substances can interfere with the optical signal. Routine calibration and consistent sample handling matter more than the sticker price of the instrument.
For anyone selecting equipment for low-turbidity drinking water work:
- Prioritize low detection limits (below 0.02 NTU) over broad range
- Confirm the instrument meets ISO 7027 or equivalent analytical method specifications
- Check drift stability over multi-hour continuous monitoring runs
Does Turbidity Mean Your Water Is Unsafe?
Not by itself. Turbidity is an optical indicator, not a biological or chemical test, and it has to be read alongside other parameters and actual microbial testing to say anything definitive about safety. A reading of 0.3 NTU with a healthy chlorine residual is a very different situation than the same reading following a known filter failure.
The health mechanism is straightforward: suspended particles can physically shield bacteria, viruses, and protozoa like Cryptosporidium and Giardia from chlorine, chloramine, or UV disinfection. A cluster of clay particles can travel through a treatment train with a pathogen tucked inside it, effectively riding out the disinfection step unharmed. That’s why some jurisdictions push treated-water targets down toward 0.1 NTU with continuous monitoring sensitive enough to catch changes under 0.1 NTU, well below what older regulations required.
Plant operators watch relative movement, not just absolute numbers. A jump of 50% or more above the recent baseline typically triggers investigation even if the reading technically stays under the regulatory ceiling, because a sudden spike usually means something specific broke: a filter, a coagulation dose, a backwash sequence.
Turbidity readings alone cannot confirm water is free of pathogens. Confirming safety after an unusual reading requires direct microbial testing for E. coli, Cryptosporidium, or Giardia rather than turbidity data alone.
Municipal systems run continuous, multi-barrier monitoring with automated alarms. Private well owners typically rely on periodic spot testing, which means a turbidity change can go unnoticed for weeks unless someone actually looks. If you’re on a well, that gap is worth taking seriously and testing more often than a municipal customer would need to.
How Water Systems Remove Turbidity (and What You Can Do)
Municipal treatment plants reduce turbidity through a sequence of barriers, each catching what the last one missed. Coagulation adds chemicals that make small particles clump together. Flocculation gently mixes the water so those clumps grow larger. Sedimentation lets the heavier clumps settle out. Filtration, usually through rapid sand or dual-media beds, catches what’s left before disinfection finishes the job.
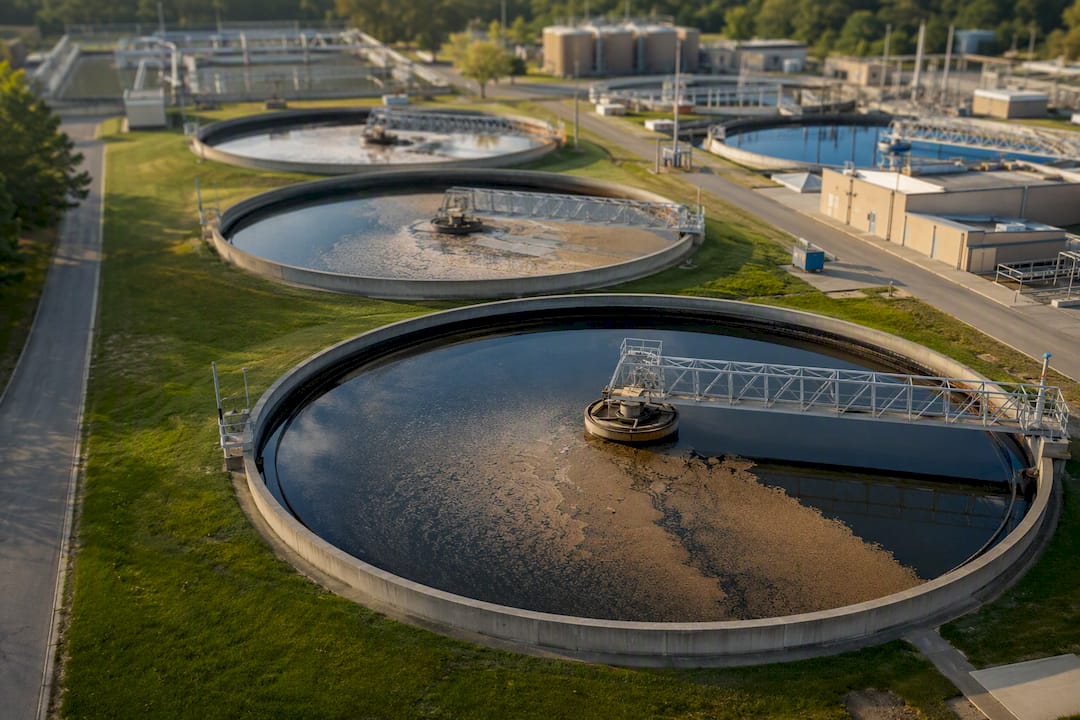
Spikes usually trace back to a specific operational event: filter media breaking through after too many run hours, backwashing at the wrong interval, or a filter restarting without an adequate flush. Standard operator responses include running the first flush to waste after backwash and slow-starting filters rather than throwing them back online at full flow immediately.
If your household water turns visibly cloudy:
- Let a glass sit for a few minutes; if it clears from the bottom up, it’s likely just trapped air, not sediment.
- Check for any active boil-water advisory from your utility before drinking or cooking with it.
- Consider a certified point-of-use filter (look for NSF/ANSI 53, 58, or 401 certification depending on the contaminant of concern) if turbidity recurs.
- Bottled water is a reasonable short-term substitute while you sort out the cause.
For facility operators investigating a spike, work through it in order:
- Check raw-water quality and recent weather events upstream.
- Confirm coagulation chemical dose and pH are on target.
- Inspect filter media for breakthrough or mudball formation.
- Review recent maintenance logs and backwash timing.
- Cross-reference with distribution-side reports to distinguish plant issues from pipe sediment.
Getting Turbidity Sampling and QA/QC Right
A single grab sample from the wrong depth or location can misrepresent an entire reservoir. Surface water sources benefit from depth-integrated or multiple-point sampling, since turbidity often varies significantly with depth and horizontal position, especially after storm runoff. Continuous monitors at key plant checkpoints catch short spikes that a once-daily spot check would simply miss.
QA/QC discipline is what makes a reading trustworthy in the first place:
- Calibrate instruments against Formazin or certified secondary standards on a fixed schedule.
- Run blanks and duplicate samples to catch drift or contamination.
- Avoid introducing air bubbles when filling sample cells.
- Measure promptly or hold samples at controlled temperature if delay is unavoidable.
- Document chain-of-custody for any sample headed to an outside lab.
Reporting precision should scale with the reading itself. Standard guidance calls for reporting to 0.05 NTU in the 0 to 1.0 NTU range, 0.1 NTU between 1 and 10, and whole numbers above 10. Reporting a 0.08 NTU reading as “0.1” might sound like a rounding nitpick, but at that range it can obscure exactly the kind of small shift operators are trained to catch early.
Where to Verify Your Local Turbidity and Water Quality Data
Your utility’s Consumer Confidence Report is the first stop, followed by your state’s drinking water dashboard and the EPA’s own monitoring database. These are the official records regulators use, and they matter more than word-of-mouth or a neighbor’s water softener anecdote.

Tapwaterindex pulls directly from EPA monitoring data to build searchable reports by city, ZIP code, or supplier, covering turbidity-relevant indicators alongside contaminants like lead and gross beta particle activity.
Pro Tip: Search your utility by name or ZIP code on Tapwaterindex, then compare recent violation history against your state’s average to see whether a turbidity concern is an isolated event or part of a longer pattern.
Why This Number Matters More Than People Assume
I check turbidity data before almost anything else when I look at a utility’s history, not because it’s the scariest number on the page, but because it’s the earliest one to move. Taste and appearance complaints usually show up after turbidity already spiked. For households with infants, elderly residents, or anyone immunocompromised, that early warning is not a minor detail.
Professionals treat turbidity as a tripwire embedded in a much larger multi-barrier system, not a standalone verdict. Consumers should treat it the same way.
Check Your Local Water Quality Data Now
Reading about NTU targets and ISO standards is one thing. Knowing what your own utility has actually reported is another, and that’s the gap Tapwaterindex exists to close.
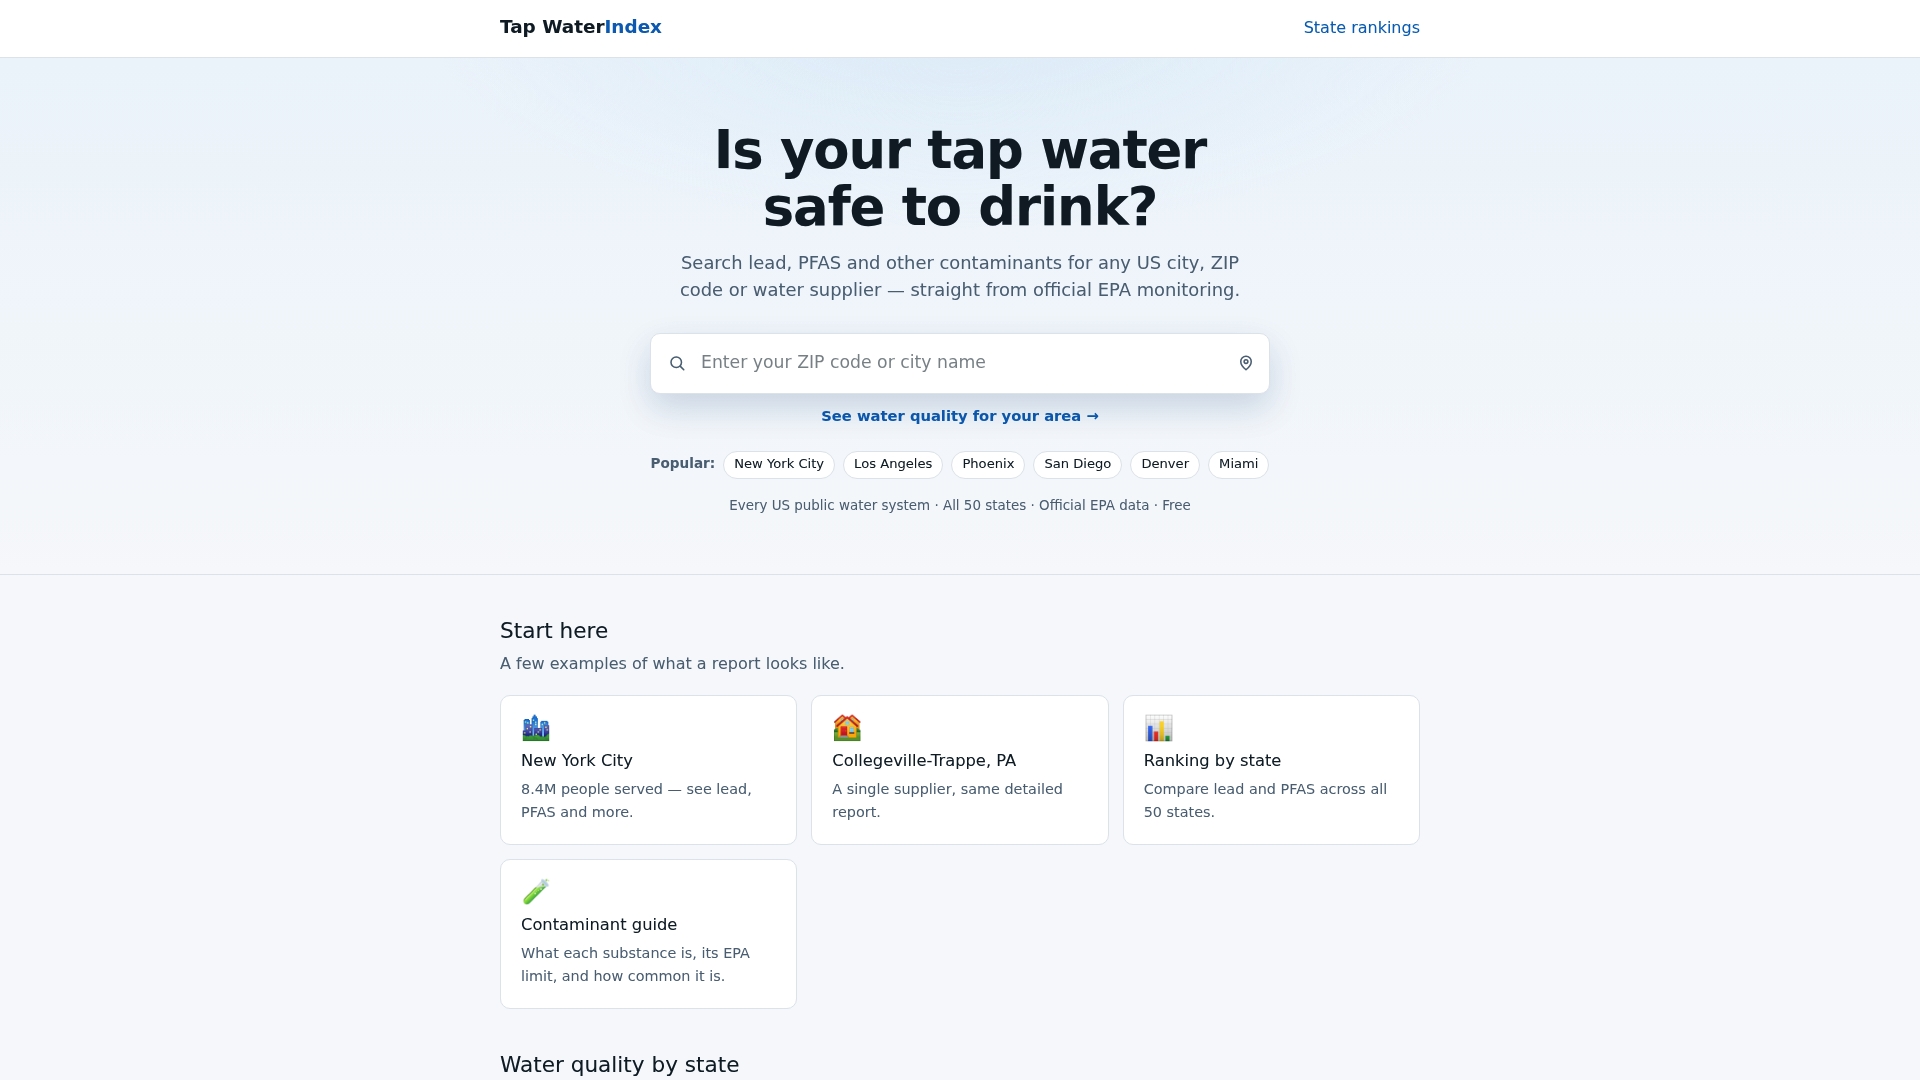
Tapwaterindex pulls straight from official EPA monitoring records to build searchable reports by city, ZIP code, or supplier, covering turbidity-adjacent indicators alongside contaminants like lead and PFAS. Instead of digging through a state dashboard or a dense annual report PDF, you get a summary built for a specific address. If your household water has looked cloudy lately, or you just want to know how your supplier’s compliance history stacks up, start with the state-by-state water quality rankings or search your own utility directly at Tapwaterindex to see what the official data actually shows.
Frequently Asked Questions
What is considered a safe turbidity level in drinking water? Most treated water targets sit at or below 0.1 NTU, with regulatory limits generally capping at 1.0 NTU for filtered systems. Anything trending upward from a utility’s normal baseline warrants attention even if it stays technically under that number.
Can turbidity alone tell me if my water has bacteria in it? No. Turbidity is an optical reading, not a microbial test. It’s a useful early signal that conditions might favor pathogen survival, but confirming actual contamination requires direct testing for organisms like E. coli, Cryptosporidium, or Giardia.
Why does my tap water sometimes look cloudy but taste fine? Trapped air bubbles are a common, harmless cause and usually clear from the bottom of a glass within minutes. Persistent cloudiness that doesn’t clear is more likely sediment, iron precipitate, or a distribution-system disturbance worth reporting to your utility.
How is turbidity different from water hardness or TDS? Turbidity measures suspended particles scattering light. Hardness measures dissolved calcium and magnesium, and total dissolved solids (TDS) measures all dissolved material combined. A sample can be perfectly clear and still have high hardness or TDS.
Do private well owners need to worry about turbidity more than city water users? Private wells typically get tested far less often than municipal systems, which run continuous monitoring with automated alarms. That gap means a turbidity change on a private well can go unnoticed longer, so more frequent independent testing makes sense for well owners.
This article is general information, not a substitute for advice from a qualified doctor. Consult a qualified healthcare professional about your own circumstances before acting on anything here.
Sources
- Water quality and health: Review of turbidity (WHO technical brief)
- Turbidity (EPA parameter factsheet)
- Turbidity | U.S. Geological Survey
- Analytical Method for Turbidity Measurement Standard Methods 2130 A and B (EPA/NEPIS)