Find Your U.S. Consumer Confidence Report in 5 Minutes on Tapwaterindex
A Consumer Confidence Report is your water utility’s required annual water quality report, and federal law says it has to reach you by July 1 covering the previous calendar year. If you haven’t seen yours, start with the EPA’s CCR search tool or search your utility’s name directly online.
TL;DR:
- Most water quality tests are performed over the entire year, meaning recent test results may not reflect the current water conditions.
- Utilities serving more than 100,000 people are required to publish their CCR online and share a direct link, while smaller systems often mail paper reports.
- The contaminant table in the CCR shows detected levels versus legal limits, but a level below the limit usually does not indicate an immediate health concern.
- Violations in the CCR may be due to single testing errors or paperwork issues and do not necessarily mean your tap water is unsafe.
- Tools like Tapwaterindex provide a clearer comparison of local water quality levels and monitor trends beyond what the static CCR report offers.
Table of Contents
- What the Safe Drinking Water Act Requires (and Why Some Data Feels Old)
- How to Track Down Your Report
- What’s Actually Inside the Report
- Reading the Contaminant Table Without Getting Confused
- If Your Report Shows a Violation, Don’t Panic Yet
- What Your CCR Can’t Tell You
- How Tapwaterindex Fills the Gap Between the Report and Your Faucet
- Why Checking Your Report Actually Matters
- Get Your Local Water Report Explained, Not Just Listed
- Where to Verify This Yourself
- Sources
What the Safe Drinking Water Act Requires (and Why Some Data Feels Old)
The Safe Drinking Water Act requires every community water system in the country to publish a CCR once a year and get it into customers’ hands by July 1. The report has to cover the full prior calendar year, so a report you get in June 2026 is describing what came out of your tap during 2025, not what’s flowing right now.
That gap matters more than most people realize. Water testing doesn’t happen the day before the report ships. It’s compiled from monitoring done throughout the year, and for some contaminants, from monitoring done over several years.
Delivery rules also shift depending on system size:
- Systems serving 100,000 people or more must post their current report on a public website and send customers a direct URL, not just a mailed copy.
- Smaller systems often mail a printed report or include it with a water bill.
- Some states layer on additional notice requirements, like publishing in a local newspaper, on top of the federal minimum.
If your provider serves a small town, don’t expect the same polished web posting a big city utility offers. The information is still required. It just might arrive on paper.
How to Track Down Your Report
Finding your CCR usually takes less than five minutes if you know where to look. Work through these in order:
- Search EPA’s CCR tool first. Go to epa.gov/ccr and enter your ZIP code or your utility’s name. This is the fastest centralized way to pull up a report without digging through a city website.
- Check your utility’s own website. Most utilities post a PDF under a “water quality” or “annual report” tab, and it often has more detail than what’s indexed elsewhere.
- Look at your water bill. Many utilities print a summary or a link directly on the bill, especially in the June or July billing cycle.
- Call the utility if you come up empty. Ask specifically for the “Consumer Confidence Report” by name; front-line staff recognize that term even if their phone menu doesn’t mention it.
If you don’t know who supplies your water, check a recent water bill or search your city name plus “water utility” or “water department.” Renters can also ask a landlord directly, and tenant-transparency resources like DWELR are worth checking if a landlord is slow to respond about utility details.
What’s Actually Inside the Report
Every CCR follows a similar structure even though the layout varies by utility. Once you know what you’re looking at, scanning one takes a few minutes instead of twenty.
Expect these sections:
- Water source information — whether your supply comes from a river, reservoir, or groundwater well.
- A contaminant table — this is the core of the report, listing everything tested and how it compared to legal limits.
- Health effects language — required wording about certain contaminants, often aimed at people who are pregnant, immunocompromised, or have infants at home.
- Violations and explanations — any instance where a result exceeded a legal limit, plus the utility’s required explanation.
- Contact information — who to call with questions.
The contaminant table is where most of the substance lives. It includes the Maximum Contaminant Level (MCL), the amount actually detected, the units of measurement, and the likely source of that contaminant, things like “erosion of natural deposits” or “runoff from fertilizer use.” Common entries include lead, PFAS, nitrate, and disinfection byproducts (DBPs), each governed by its own limit and testing schedule. You can cross-reference specific limits on a contaminant reference guide if the report’s shorthand isn’t clear.
Reading the Contaminant Table Without Getting Confused
Start with “Level Detected” and stack it directly against the MCL, the legal ceiling for that substance. If the detected level sits below the MCL, that alone usually isn’t cause for alarm, even if the substance showed up at all. Detection and violation are two different things.
You’ll also see an MCLG, the Maximum Contaminant Level Goal. This is the level EPA would set with zero health risk in mind, before factoring in what’s technically and economically achievable at scale. The MCL is usually higher than the MCLG for that reason, and seeing both numbers side by side is normal, not a red flag.
Units trip people up constantly. Most contaminants are reported in parts per billion (ppb) or parts per million (ppm), and radioactive contaminants show up in picocuries per liter (pCi/L). Lead and copper work differently. Instead of a simple average, utilities report a 90th percentile value from home tap sampling, meaning 90% of tested homes came in at or below that number. That’s the “action level” trigger, not a straightforward MCL.
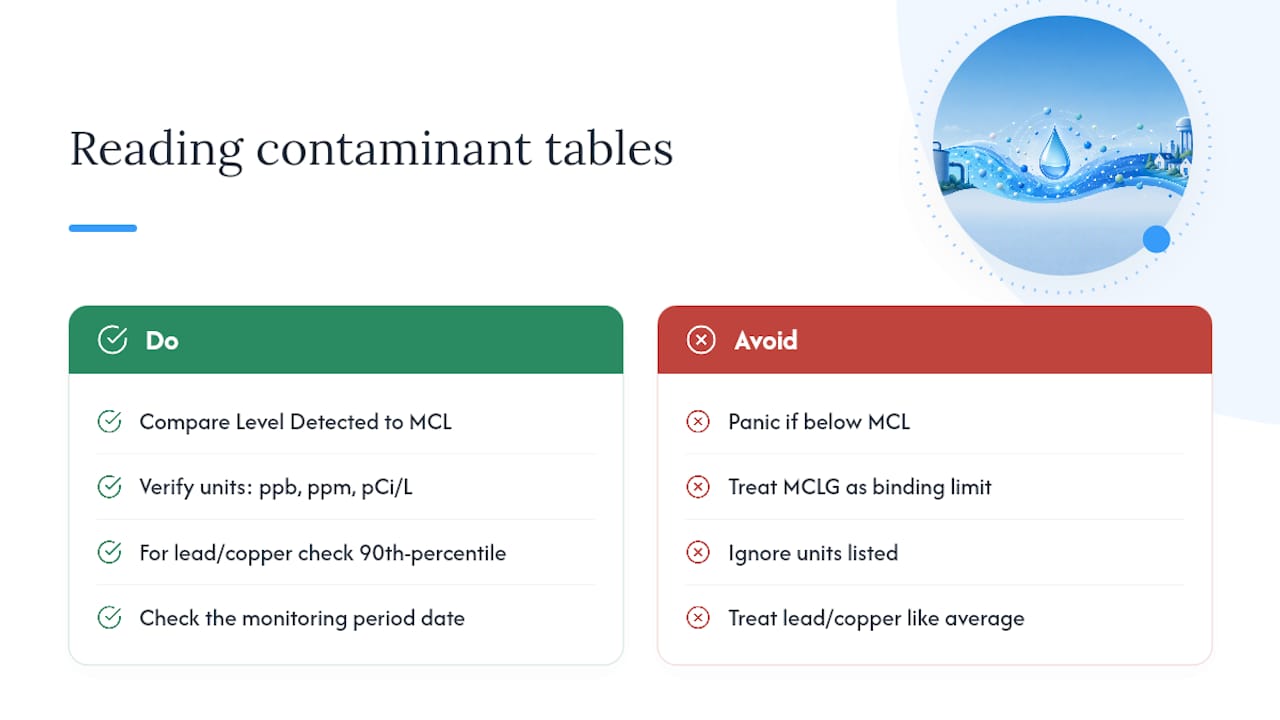
Pro Tip: Always check the monitoring period listed at the top of the table before reacting to a number. A “not detected” result from three years ago tells you less than a fresh sample from last quarter, and the report should specify which you’re looking at.
If Your Report Shows a Violation, Don’t Panic Yet
A listed violation is not automatically a household emergency. Sometimes it reflects a single sample that exceeded a limit before the utility corrected the issue, or a paperwork violation, like a missed monitoring deadline, rather than a contamination event. Utilities are required to explain each violation directly in the report, including what caused it and what corrective steps followed.
Work through this before you assume the worst:
- Read the utility’s written explanation in full; it usually states whether the issue is resolved.
- Call the utility directly and ask for current, not historical, test results.
- Contact your state drinking water agency if the utility’s answer feels incomplete.
- Call the EPA Safe Drinking Water Hotline at 1-800-426-4791 if you’re still stuck.
If you want an added layer of protection while you sort it out, a point-of-use filter certified for the specific contaminant in question, activated carbon for many organics, reverse osmosis for a broader range, is a reasonable interim step. Match the filter to the contaminant; a generic pitcher filter won’t touch PFAS the way a certified reverse osmosis system will.
What Your CCR Can’t Tell You
A CCR is a transparency document, not a live sensor in your kitchen. It has real limits worth knowing before you treat it as the final word.
- Not every contaminant gets tested annually. Some have stable histories and are monitored on a multi-year rotation, so a “no detection” result might be several years old.
- CCRs only cover public water systems. If you’re on a private well, there’s no report coming; you’re responsible for your own testing.
- Lead results are often system-wide averages or targeted sample sets, not a reading from your specific faucet. Older plumbing or lead service lines can push your tap level higher than what the report shows, which is why the CDC recommends tap-specific testing when lead is a concern.
How Tapwaterindex Fills the Gap Between the Report and Your Faucet
A CCR gives you a snapshot for one system. Tapwaterindex lets you search by city, ZIP code, or supplier name and see EPA monitoring results laid out plainly, including lead and PFAS, without wading through a PDF written for regulators.
- Compare your supplier’s contaminant levels against other utilities in your state, not just against the legal limit.
- Follow direct links back to the original EPA data behind every figure shown.
- Revisit past years of results for the same supplier to see whether a number found in your CCR is trending up, down, or holding steady.
If your CCR flagged something you didn’t fully understand, running your supplier through the state ranking tool is a fast way to see where it stands.
Why Checking Your Report Actually Matters
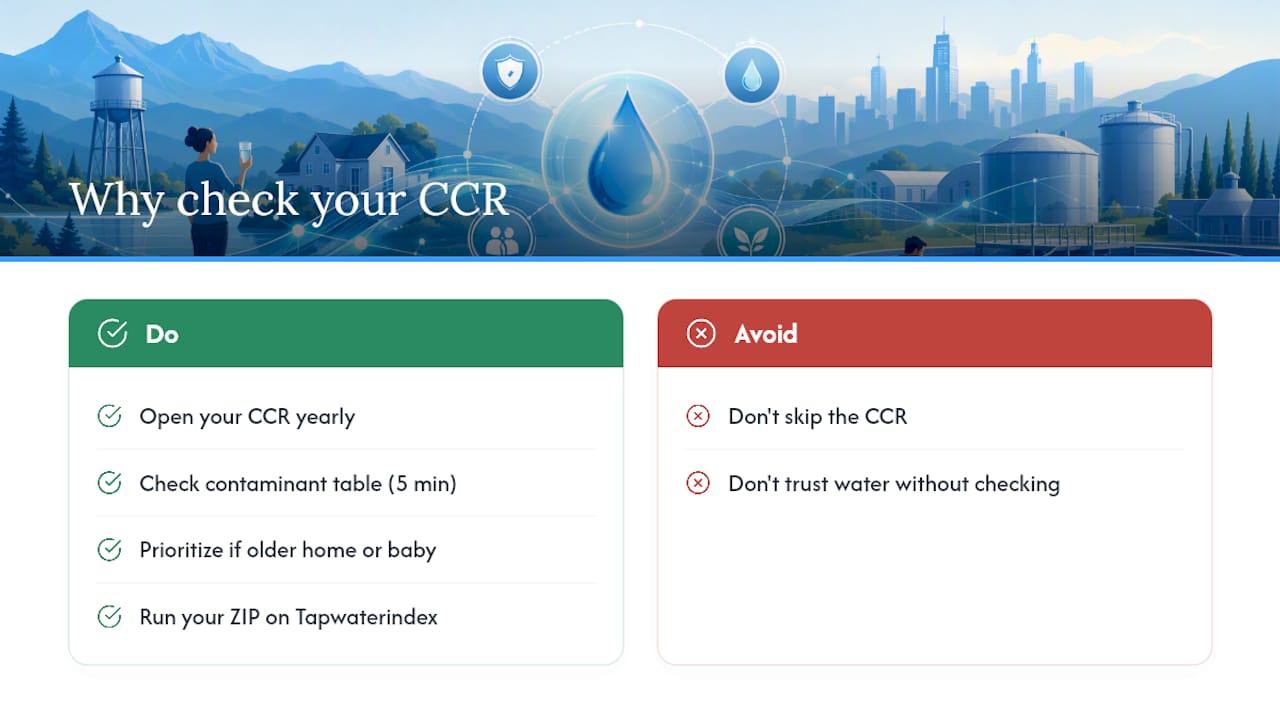
Most people never open their CCR, and I get why: the format reads like it was written for an audit, not a homeowner. But the report is one of the only places where a utility is legally forced to disclose exactly what showed up in its testing and explain any violation in plain terms. Skipping it means trusting that everything is fine without ever checking.
My honest take, after digging through dozens of these reports for this piece: the contaminant table is worth five minutes of your time once a year, especially if you have an older home or a baby in the house. Run your ZIP through Tapwaterindex right after you read your CCR. It’s the fastest way to see whether what you just read lines up with the broader picture in your state.
— Sergey
Get Your Local Water Report Explained, Not Just Listed
Reading a raw EPA contaminant table is one option. A faster route is letting Tapwaterindex do the translating for you, pulling the same official monitoring data your CCR is built from and laying it out by city, ZIP code, or supplier so you’re not cross-referencing acronyms on your own.
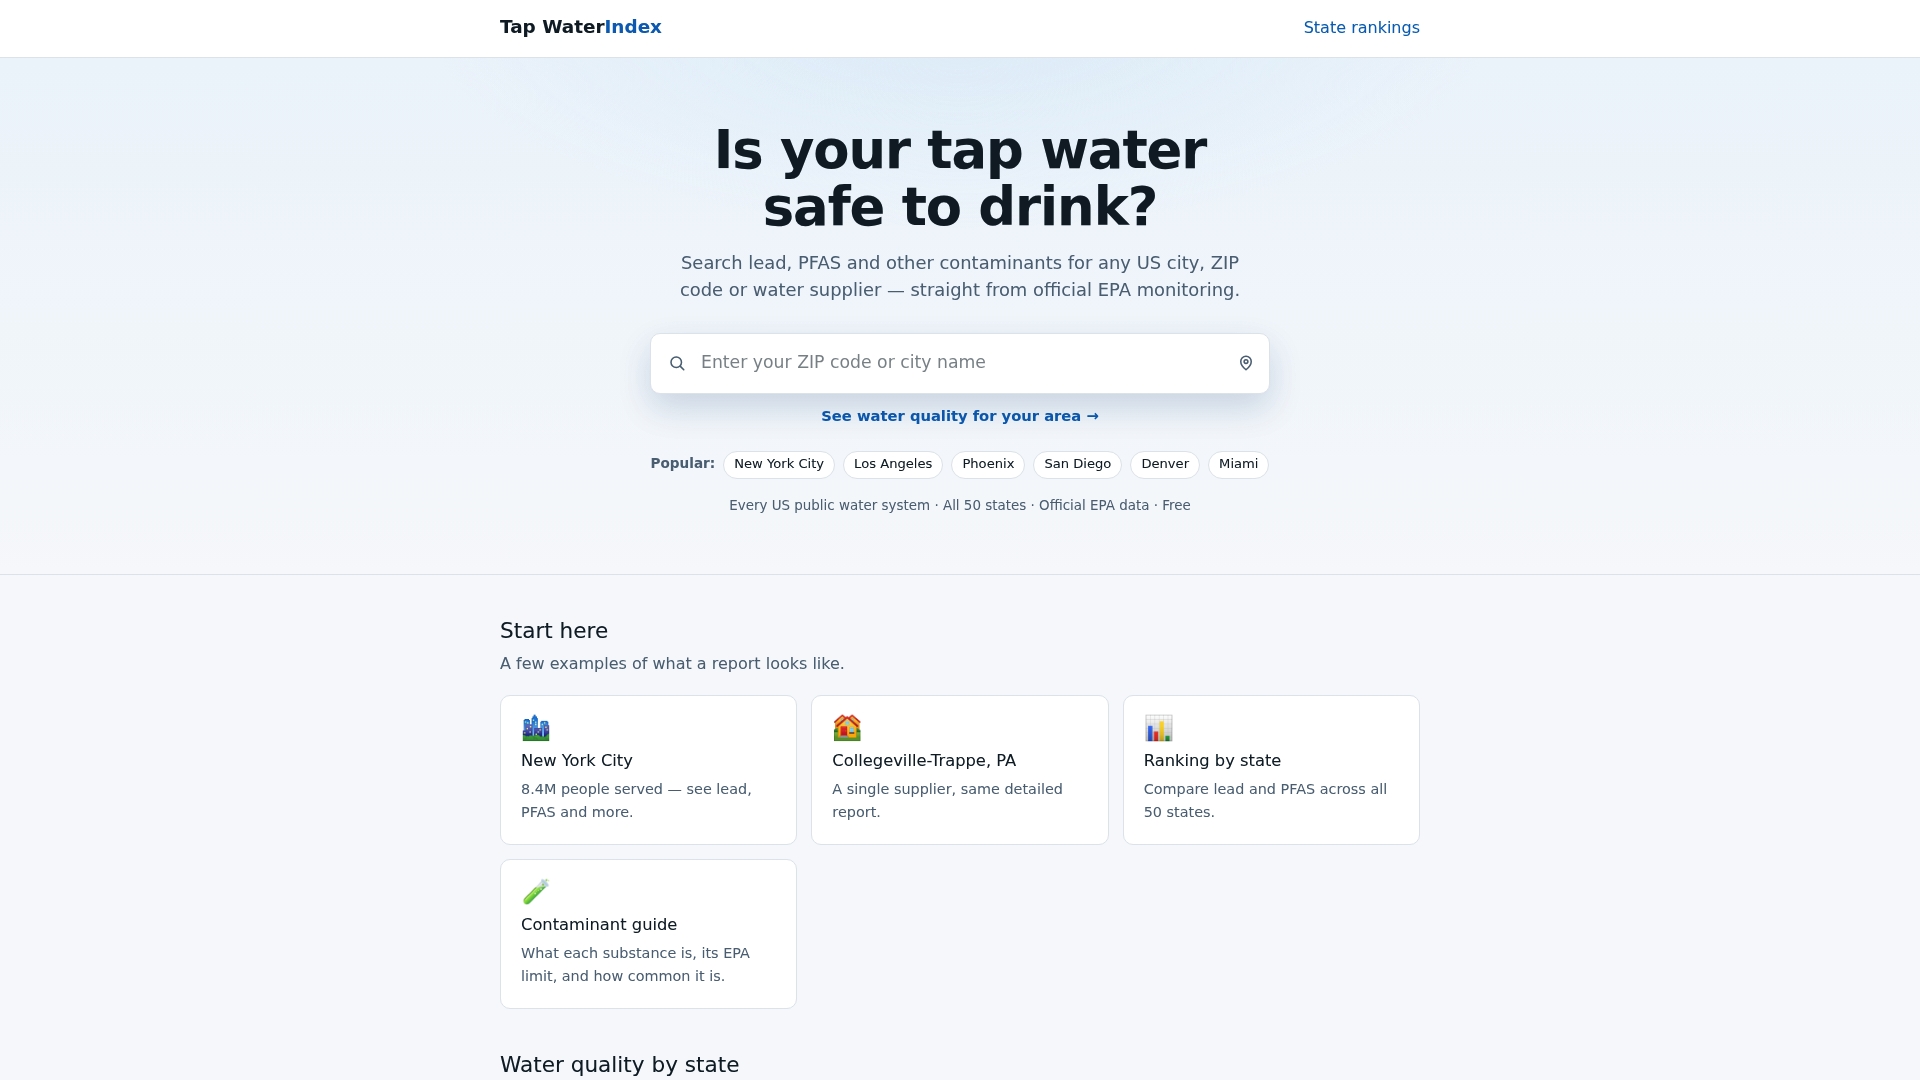
Every figure on the site traces back to EPA monitoring data, not a private lab or a marketing claim, so what you see is the same underlying record your utility already reports on. If lead is your main worry, the state-by-state breakdowns for places like Florida, Massachusetts, and Colorado show exactly how your supplier compares to others nearby. Search your own state ranking now and see where your water supplier lands before your next CCR even arrives.
Where to Verify This Yourself
Confirm requirements directly through EPA’s CCR search tool, CDC’s guide to reading water reports, or by contacting your state drinking water agency for unresolved questions.
Sources
- Safe Drinking Water Act: Consumer Confidence Reports (CCR) | US EPA
- How to read drinking water quality reports | CDC
- Consumer Confidence Reports (CCR) CCR search | US EPA