95,350+ Tests, No PFAS: San Francisco Tap Water Is Safe
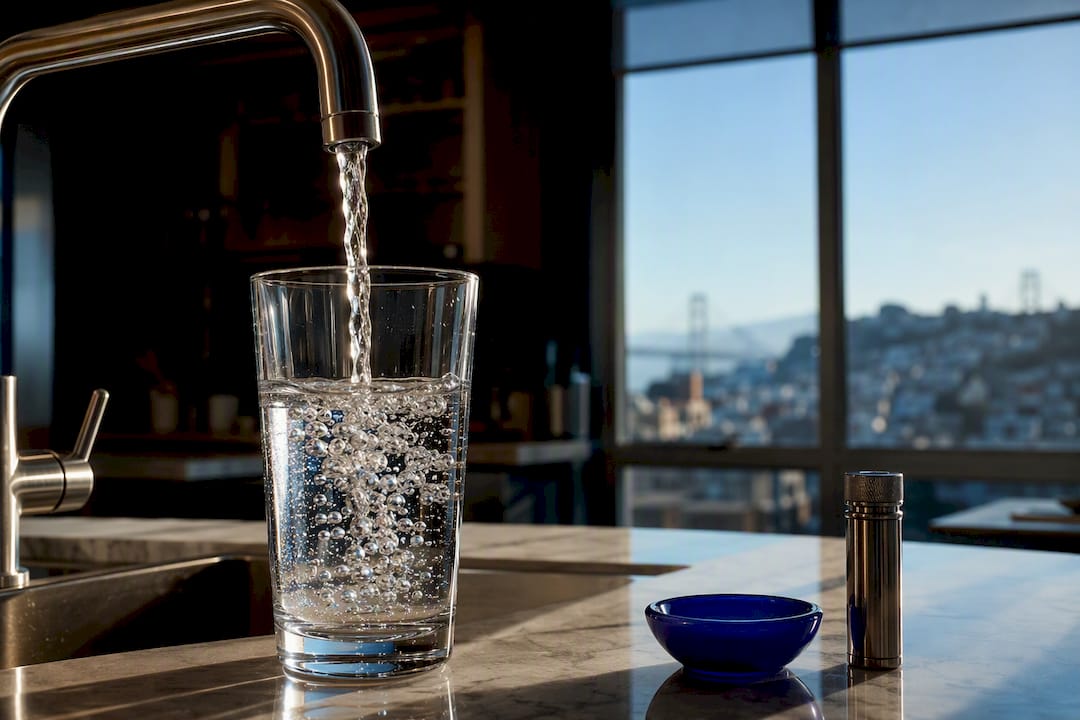
Yes. San Francisco’s tap water meets or exceeds every federal and state drinking water standard, according to the San Francisco Public Utilities Commission’s 2025 water quality report, which found no PFAS detected across the system. The one caveat: your building’s internal plumbing, not the water leaving the treatment plant, is where most residual lead risk actually lives.
TL;DR:
- San Francisco’s water leaves the treatment plant free of PFAS and meets all federal and state standards, but lead risks primarily originate from building plumbing.
- The city’s water is sourced from a protected watershed in Yosemite, which significantly reduces contamination and simplifies treatment.
- System-level tests show a 90th percentile lead level of approximately 4.9 parts per billion, well below EPA’s 15 ppb action limit, but individual building plumbing may still pose risks.
- Regular testing and using NSF-certified filters at home can effectively reduce lead exposure for residents, especially in older buildings with suspect plumbing.
- Discolored or foul-smelling water is typically local, not citywide, and should be checked faucet by faucet; ongoing issues should be reported to SF311 or the State Water Board.
Table of Contents
- Where San Francisco’s Water Comes From and Why the Source Matters
- What SFPUC Tests and What the Latest Results Show
- Lead, PFAS, Chromium-6, Microplastics: What the Data Actually Says
- How Treatment Plants Turn Reservoir Water Into Tap Water
- Your Building’s Plumbing Is the Real Wild Card
- Where to Check Current San Francisco Water Reports Yourself
- What to Do If Your Water Looks or Smells Off
- What the Data Actually Tells You, and What It Doesn’t
- Look Up Your Exact Address on TapWaterIndex
- Sources
Where San Francisco’s Water Comes From and Why the Source Matters
Most of San Francisco’s drinking water starts as snowmelt in the Hetch Hetchy Reservoir, fed by the Tuolumne River inside Yosemite National Park. The SFPUC controls roughly 60,000 acres of watershed land surrounding the reservoir, keeping development, agriculture, and livestock away from the source.
That distance from human activity is not a minor detail. A protected watershed means fewer agricultural runoff chemicals, less industrial contamination, and dramatically less pretreatment work before the water is safe to disinfect and deliver.
- Gravity carries most of the water more than 160 miles from the Sierra Nevada to the Bay Area, reducing the need for heavy pumping and the equipment failures that come with it.
- A protected source is also why SFPUC frequently cites watershed stewardship as a foundation of its water quality claims, not just a footnote.
- Fewer upstream contaminants translate into simpler, more predictable treatment at the plant level.
What SFPUC Tests and What the Latest Results Show
The SFPUC ran tens of thousands of individual water quality tests in the reporting period covered by its 2025 Annual Water Quality Report, checking for everything from bacteria to industrial chemicals. Every result met or exceeded both federal Environmental Protection Agency and California State Water Resources Control Board limits.
The headline finding making local news: no PFAS was detected anywhere in the distribution system during this testing cycle. PFAS, the so-called “forever chemicals” tied to nonstick cookware and firefighting foam, has become one of the most searched contaminant categories nationally, and San Francisco’s result stands out precisely because so many other utilities report at least trace levels.
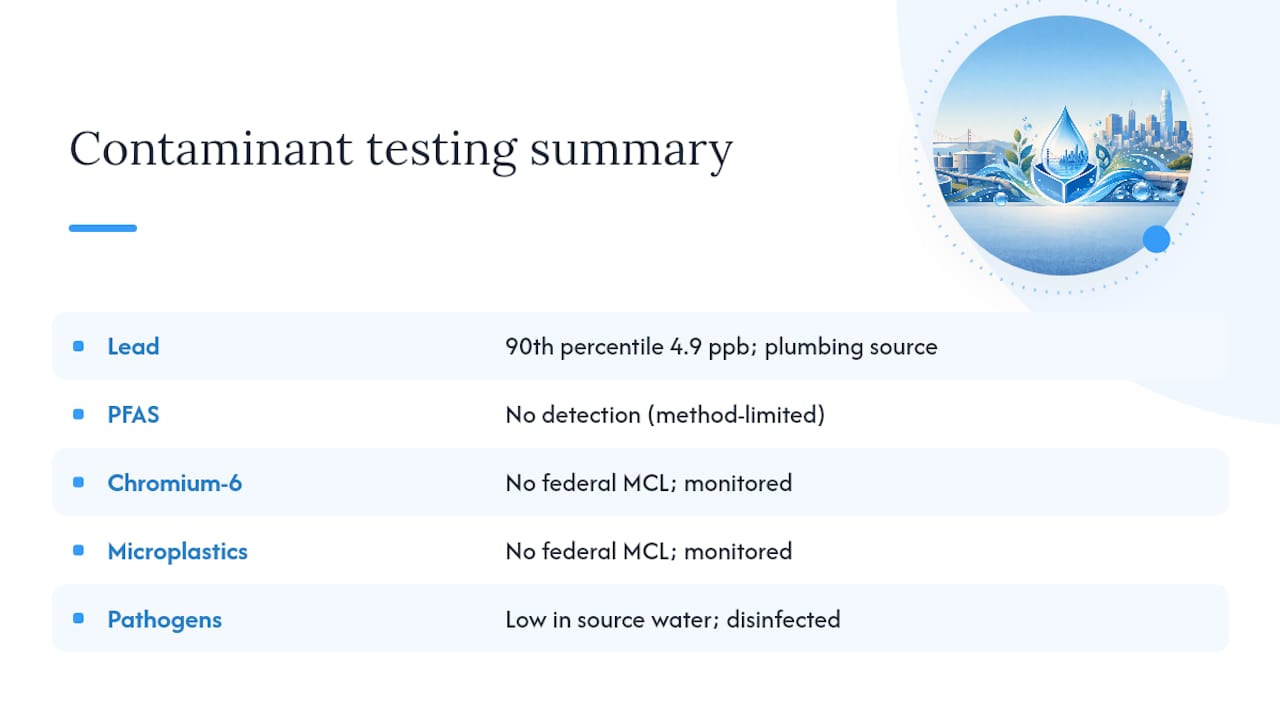
- Lead and Copper Rule monitoring: the most recent triennial round, sampling 50 tap sites across the city, produced a 90th percentile lead result of about 4.9 parts per billion, well under the EPA’s 15 ppb action level.
- The next round of Lead and Copper Rule sampling is scheduled for 2027.
- All these figures reflect system-level testing at the point water leaves SFPUC’s control, not what happens inside individual buildings.
That last distinction matters more than most residents realize, and it’s the subject of the plumbing section further down.
Lead, PFAS, Chromium-6, Microplastics: What the Data Actually Says
San Francisco tap water safety questions almost always circle back to five contaminants. Here’s what the testing record shows for each.
Lead rarely comes from the water source itself. It gets into tap water through old service lines, solder, or fixtures inside a building’s own plumbing, which is why the SFPUC’s system-level 90th percentile of 4.9 ppb doesn’t guarantee a lead-free glass in every home. Pregnant people and children under six face the highest health risk from even low-level lead exposure, since it affects developing nervous systems.
PFAS covers thousands of synthetic compounds used in everything from carpet treatments to food packaging. San Francisco’s no-detection result is genuinely good news, though it’s worth knowing that “no detection” reflects the sensitivity of current lab methods and the specific PFAS compounds screened, not an absolute guarantee of zero PFAS at every possible concentration. You can check PFAS monitoring data for California suppliers for broader state context.
Chromium-6 and microplastics remain harder to pin down. Neither has a federal maximum contaminant level yet, so utilities monitor them as contaminants of emerging concern rather than against a hard regulatory line.
Pathogens like Giardia and Cryptosporidium show up at low levels in raw source water before treatment, but disinfection at the treatment plant neutralizes them before distribution. People with weakened immune systems remain the group most vulnerable if treatment ever falls short.
Pro Tip: If you want the full picture on any single contaminant, including its EPA limit and how it’s typically measured, TapWaterIndex’s contaminant guide breaks each one down without the technical jargon.
How Treatment Plants Turn Reservoir Water Into Tap Water
Water travels from the protected Hetch Hetchy watershed to treatment facilities like the Harry Tracy Water Treatment Plant and the Sunol Valley Water Treatment Plant before reaching any tap. Along the way it passes through several defined stages.
- Ozonation, an oxidation step being expanded at the Sunol facility, breaks down organic compounds that cause taste and odor problems, on top of providing an added layer of disinfection.
- Chlorination handles the final disinfection step, killing bacteria and viruses that survive earlier treatment.
- Fluoride is added at controlled levels for dental health, consistent with state guidelines.
- Certified operators staff control rooms around the clock, adjusting treatment in real time based on continuous sensor readings, not just periodic lab samples.
That combination of automated monitoring and human oversight is why SFPUC can catch a problem within hours rather than discovering it in a quarterly report.
Your Building’s Plumbing Is the Real Wild Card
Here’s the gap that trips up most people: SFPUC’s own inventory shows no known lead service lines connecting the city’s water mains to buildings, but that doesn’t mean every home is lead-free. Older buildings can still have lead solder, brass fixtures, or interior pipes installed before modern plumbing codes.
Three things actually reduce your exposure if you’re worried:
- Order a low-cost tap water test through SFPUC for $25 per sample; WIC voucher holders can access testing at no cost.
- Run cold water for 30 to 60 seconds after the tap has sat unused for several hours, and always use cold water for cooking or baby formula, since hot water pulls more lead from old pipes.
- Look for a point-of-use filter certified under NSF/ANSI Standard 53 for lead reduction if your test comes back elevated, and consider options for household water treatment as described by Svenskt Vattenfilter, and replace fixtures older than a few decades if lead solder is suspected.
For a look at how lead results vary supplier by supplier across the state, TapWaterIndex’s California lead data puts San Francisco’s numbers in context against other systems.
Where to Check Current San Francisco Water Reports Yourself
You don’t have to take any single source’s word for it. Several official channels publish the underlying San Francisco water quality data directly.
- The SFPUC publishes its full annual water quality report online every year, along with any active alerts on Sf.
- The EPA’s ECHO facility database tracks San Francisco’s compliance history and any violations logged against federal standards.
- The California State Water Resources Control Board’s Division of Drinking Water oversees statewide enforcement and publishes regulatory context beyond what a single utility report covers.
- TapWaterIndex pulls from that same EPA monitoring data and lets you search by city, ZIP code, or water supplier if you want a faster, plain-language summary than the raw government filings.
What to Do If Your Water Looks or Smells Off
Discolored, cloudy, or foul-smelling water usually points to something local, not a citywide failure. Check whether the problem is isolated to one faucet or affects the whole building first.
- If only one tap is affected, the issue is likely that fixture or the line feeding it, not the city supply.
- Avoid drinking hot tap water if it looks discolored, and run cold water for a few minutes to see if it clears.
- Report ongoing problems to SF311 by calling 3-1-1 inside the city or 415-701-2311 from outside it.
- Escalate unresolved issues to the State Water Board’s Division of Drinking Water, and watch SFPUC’s official channels for any boil-water advisory before assuming one is needed.
What the Data Actually Tells You, and What It Doesn’t
San Francisco’s testing numbers are genuinely strong, and I don’t say that about many municipal water systems. A watershed as isolated as Hetch Hetchy is rare, and 95,350-plus tests with zero PFAS detections is not a marketing line, it’s a documented result.
But “no PFAS detected” and “no lead service lines in the inventory” are system-level claims. They tell you almost nothing about the 80-year-old apartment building with original plumbing. That’s the layer most water safety coverage skips, and it’s the layer that actually determines what comes out of your glass. Municipal reports tell you the city did its job. Local, building-level data tells you whether you need to do anything about yours. Use both. Test if your building is old or you’re pregnant or have young kids. Otherwise, monitor the annual reports and move on with your life.
— Sergey
Look Up Your Exact Address on TapWaterIndex
Knowing San Francisco’s citywide numbers is useful, but the real question is what’s happening at your specific address, and that’s where a general city report can’t help you. A public platform pulls directly from EPA monitoring data and lets you search by city, ZIP code, or water supplier to see contaminant-by-contaminant results, including PFAS and lead, without digging through a 40-page PDF.
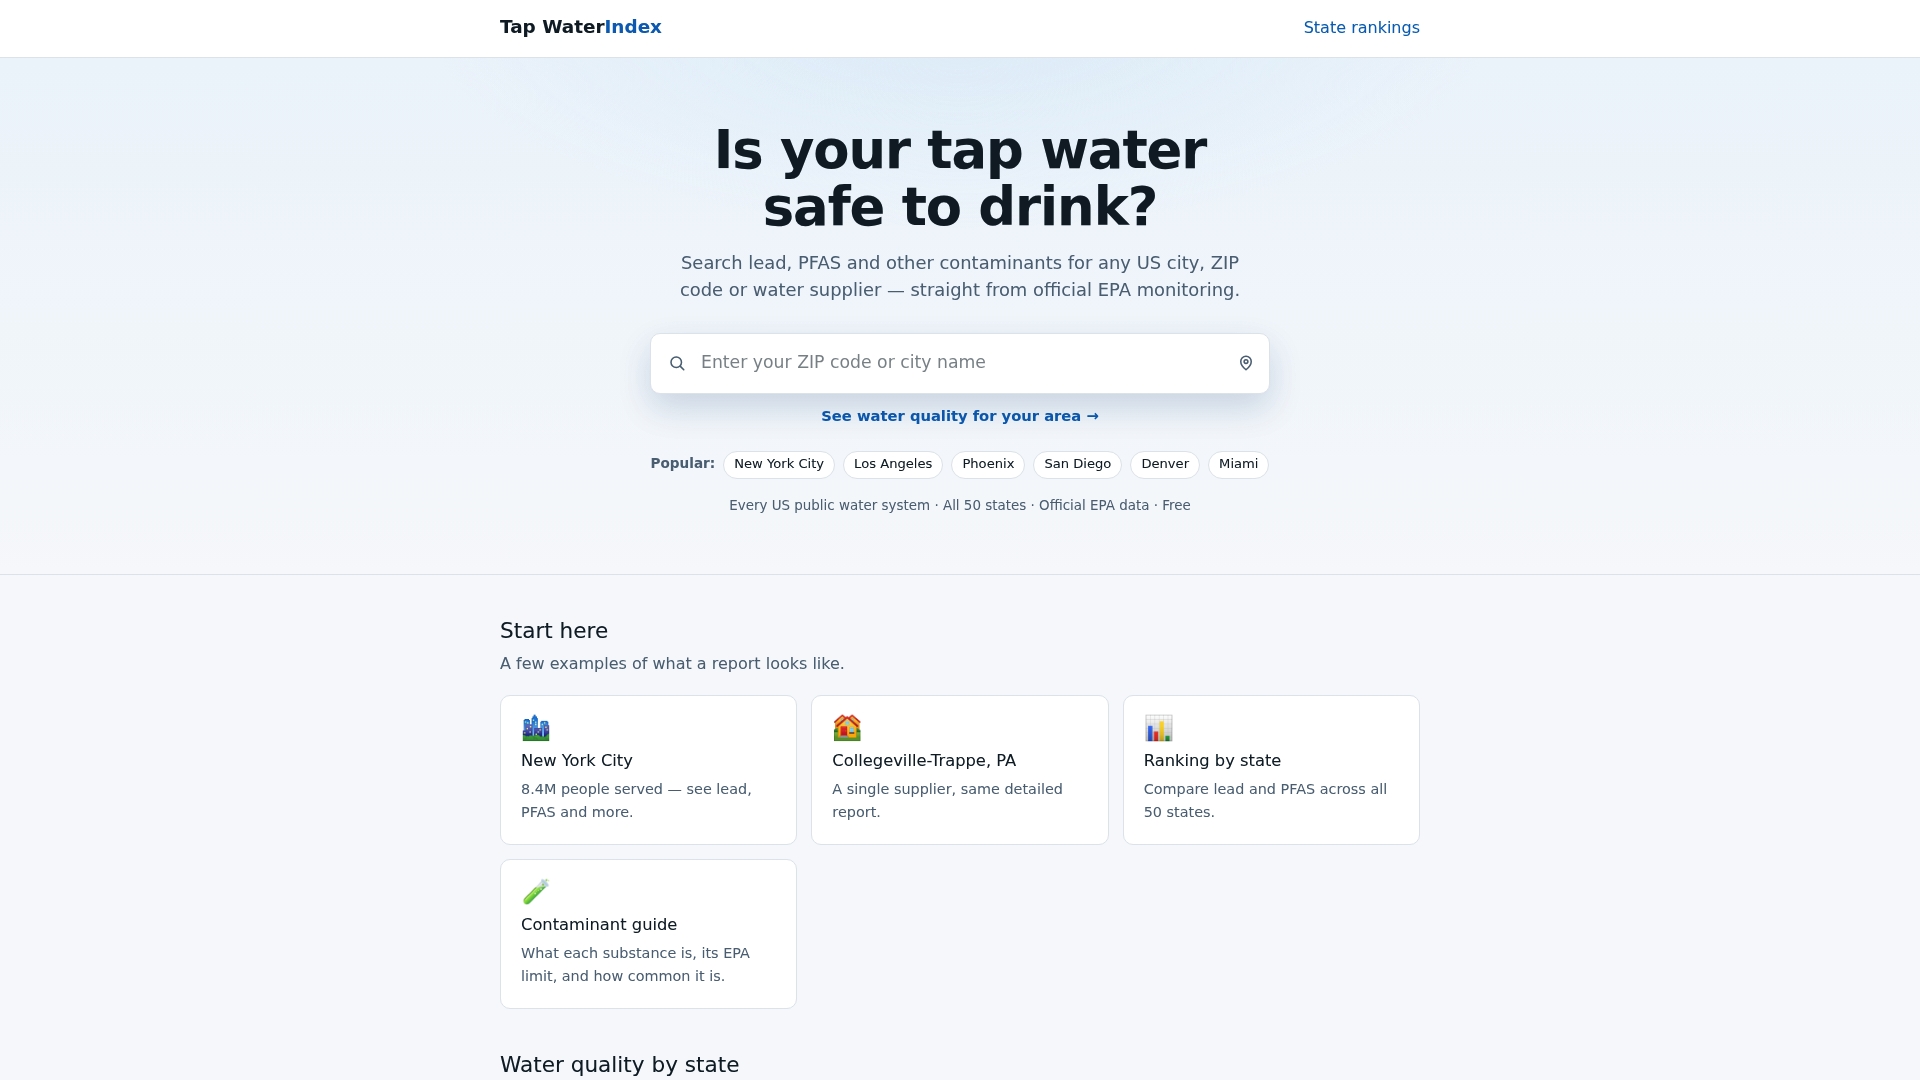
Run a quick search for your San Francisco ZIP code on TapWaterIndex to see how your local supplier compares. If you want broader context first, the state-by-state water quality rankings show how California systems stack up nationally. TapWaterIndex doesn’t replace SFPUC’s official reports or state advisories. It’s built to make that same underlying data faster to search and easier to act on.
This article is general information, not a substitute for advice from a qualified doctor. Consult a qualified healthcare professional about your own circumstances before acting on anything here.