Flint Water Crisis: What Residents Need to Know

Flint’s water crisis happened because Michigan officials switched the city’s water source to the Flint River in April 2014 and failed to apply required corrosion control treatment, letting lead leach out of aging pipes and into tens of thousands of homes. State agencies, an emergency manager, and the Michigan Department of Environmental Quality bear the primary responsibility, with the EPA and CDC documenting the fallout and helping direct the recovery. As of the July to December 2025 monitoring period, Flint’s 90th-percentile lead result measured 6 parts per billion, well under both the federal and Michigan action levels, marking a continuous compliance streak since July 2016.
That’s the headline. But “compliant” doesn’t mean the story is finished. Roughly 500 lead service lines still need replacing as of February 2026, the city’s population and tax base never recovered from the exodus that followed, and thousands of residents still carry the long-term health consequences of exposure that officials downplayed for a year and a half. If you’re trying to understand what actually happened, whether your own water might carry similar risks, or how to read a water quality report without getting misled, here’s the full picture.
- What happened: Flint switched its water source from Detroit-supplied Lake Huron water to the Flint River without adding a corrosion inhibitor, and lead leached from pipes into drinking water for roughly 18 months before the state acknowledged the problem.
- Who was responsible: Michigan’s emergency manager system, the state Department of Environmental Quality (predecessor to today’s EGLE), and slow federal oversight all share blame for the delay in action.
- Current status: Flint has met state and federal lead standards for 10 consecutive years, with a 2025 monitoring result of 6 ppb, but infrastructure work and health monitoring continue.
- Where to check your own water: Tap Water Index lets you search contaminant data by city, ZIP code, or utility using official EPA monitoring records.
Key Takeaways
Flint’s crisis stemmed from a corrosion control failure that a decade of compliance and infrastructure work has addressed, though roughly 500 lead lines and long-term health monitoring remain unfinished business.
| Point | Details |
|---|---|
| Root cause was preventable | The switch to Flint River water combined with the state’s failure to require orthophosphate corrosion control caused lead to leach from pipes. |
| Children faced the highest risk | Blood-lead levels nearly doubled citywide in children after the switch, with neurodevelopmental effects that researchers still track today. |
| Current monitoring shows compliance | Flint’s 90th-percentile lead result was 6 ppb for July to December 2025, its tenth straight year under state and federal limits. |
| Infrastructure work isn’t finished | Roughly 500 lead service lines still need replacement as of February 2026, funded through settlement money and public appropriations. |
| Legal accountability remains mixed | A $626 million civil settlement compensated residents, but the Michigan Supreme Court dismissed several felony charges on procedural grounds in 2023. |
| Check your own water directly | Use Tap Water Index to search your city, ZIP code, or utility and compare current lead and PFAS data against federal benchmarks. |
Table of Contents
- Flint Water Crisis Timeline: How the Disaster Unfolded
- What Caused the Flint Water Crisis, Technically?
- How Lead Exposure Affected Flint’s Children and Adults
- Is Flint’s Water Safe to Drink Now?
- Legal Fallout: Charges, Settlements, and Accountability
- Replacing Flint’s Pipes: Where the Infrastructure Work Stands
- Environmental Justice: Why Flint Became a National Symbol
- A Practical Checklist for Concerned Residents
- How to Check Current Flint Water Data Using Tap Water Index
- Reading Water Quality Data Without Getting Misled
- Tracking Flint’s Long-Term Health Outcomes
- Did Bottled Water and Filters Actually Solve the Problem?
- Why Flint Still Matters for National Water Policy
- Sources
Flint Water Crisis Timeline: How the Disaster Unfolded
The Flint water crisis wasn’t a single event. It was a chain of decisions, warnings, and delays stretching from 2014 through today’s ongoing infrastructure work.
- April 25, 2014: Flint switches its water source from the Detroit Water and Sewerage Department to the Flint River, while under state-appointed emergency management, as a cost-saving measure during construction of a new regional pipeline.
- Summer 2014: Residents begin reporting discolored, foul-smelling water. City officials insist it’s safe to drink.
- August to September 2014: E. coli and total coliform bacteria are detected, prompting boil-water advisories and heavier chlorination, which ironically increases the water’s corrosivity.
- January 2015: General Motors stops using Flint water at an engine plant because it’s corroding parts. The state pays for the plant to reconnect to a different water source, but Flint households remain on river water.
- February to September 2015: Independent researcher Marc Edwards and the Flint Water Study team from Virginia Tech begin testing homes and find lead levels far above federal thresholds, including one sample exceeding 13,000 parts per billion.
- September 2015: A local pediatrician, Dr. Mona Hanna-Attisha, releases data showing the percentage of Flint children with elevated blood-lead levels nearly doubled after the switch. The state initially disputes her findings before confirming them days later.
- October 2015: Flint reconnects to the Detroit water system (by then rebranded as the Great Lakes Water Authority), though pipe scale damage means lead risk persists.
- January 2016: Governor Rick Snyder declares a state of emergency; President Obama declares a federal emergency shortly after, unlocking federal aid.
- 2016 to 2017: Multiple state and federal investigations, including a task force report, place blame on regulatory failures at every level. Criminal charges begin against several state and local officials.
- 2017 to 2020: Lead service line replacement work accelerates under court-monitored settlement agreements. A $626 million civil settlement is reached in 2020 to compensate residents, with the bulk earmarked for children exposed to the water.
- 2022 to 2023: Criminal cases face setbacks. The Michigan Supreme Court dismisses felony charges against several former officials on procedural grounds related to how the indictments were obtained.
- 2025 to 2026: Flint marks its tenth consecutive year of compliance with lead standards, while roughly 500 service lines still await replacement.
Turning point: The moment that broke the crisis open publicly wasn’t a government report. It was Dr. Hanna-Attisha’s blood-lead data, backed by the Virginia Tech team’s independent sampling, that forced the state to abandon its “the water is fine” messaging. Grassroots groups like the Coalition for Clean Water and local pastors organizing bottled-water drives kept pressure on officials long before Lansing acted. The AP News timeline offers a good public-record chronology of these milestones if you want the granular version.
What Caused the Flint Water Crisis, Technically?
The Flint River switch gets blamed for the crisis, and rightly so, but the river water itself wasn’t the sole culprit. The real failure was chemical: nobody added the treatment needed to keep that water from attacking Flint’s own pipes.
Here’s the chain of cause and effect, step by step:
- The Flint River carried higher chloride levels and different mineral content than the Lake Huron water Flint had used for decades, making it more corrosive to metal pipe.
- State regulators did not require the addition of orthophosphate, a corrosion inhibitor that coats the inside of pipes with a protective mineral layer.
- Without that layer, the river water stripped away the protective scale that had built up inside Flint’s lead service lines over decades.
- Bare lead surfaces then leached directly into the water flowing to homes, especially after standing overnight in pipes, which is why “first draw” samples from a kitchen tap often showed the highest readings.
- The problem compounded in homes with older internal plumbing, lead solder, or brass fixtures containing trace lead, all of which reacted with the newly corrosive water.
Corrosion control isn’t optional under federal law. The Safe Drinking Water Act’s Lead and Copper Rule requires water systems serving more than a small population to maintain corrosion control treatment, and Michigan’s own oversight body was supposed to confirm Flint had that in place before the switch. It didn’t. That gap between what the law required and what actually happened is why researchers and public-health authors consistently describe Flint as a preventable governance failure rather than an unavoidable engineering accident.
Pro Tip: Corrosion isn’t just a Flint problem. Any home with lead service lines or lead solder (common in houses built before 1986) can experience elevated lead if water chemistry changes, even without a dramatic source switch. If your utility changes its treatment process or source, that’s a good moment to test your own tap.
How Lead Exposure Affected Flint’s Children and Adults
Lead is a neurotoxin with no safe blood level, and children absorb it far more efficiently than adults do, which is why pediatric exposure became the defining health story of the crisis. Dr. Hanna-Attisha’s original analysis found the share of Flint children with elevated blood-lead levels nearly doubled citywide after the switch, with even sharper spikes in certain neighborhoods served by the highest-lead water mains.
The health consequences break down differently depending on who was exposed:
- Infants and young children: Lead exposure at this stage is linked to lower IQ, attention and behavioral problems, delayed growth, and hearing issues. Because children’s brains are still developing, even modest exposure can have effects that surface years later in school performance.
- Pregnant people: Lead crosses the placenta, and studies tracking Flint have examined associations between the water switch and outcomes including changes in fertility rates and birth weight, adding lead exposure to the list of prenatal risk factors clinicians now watch for in the region.
- Adults: Long-term lead exposure is associated with elevated blood pressure, kidney function decline, and cognitive effects, though the risk accumulates more slowly than it does in children.
- Community-wide: Investigators also traced a spike in Legionnaires’ disease cases to the same period, tied to changes in water treatment and building plumbing systems, a connection documented in peer-reviewed public-health research on the crisis.
If you’re a Flint resident, or you suspect your own water supply might carry similar corrosion risk, blood-lead testing is the only way to know your actual exposure level. Pro Tip: Ask your pediatrician or primary care provider for a blood-lead test, and don’t skip the follow-up. A single test only shows exposure at that moment, so clinicians typically want a baseline and then a recheck a few months later to see whether levels are falling. Michigan residents can find local testing sites through the state health department, and the CDC’s Flint resource hub links to additional public-health guidance for anyone unsure where to start.
Is Flint’s Water Safe to Drink Now?
Flint’s water has met both federal and Michigan lead standards for ten straight years, but “safe” comes with an asterisk worth understanding before you take it at face value.
Every water system with lead service lines has to test a set of high-risk homes twice a year and report the 90th-percentile result, the value where 90% of samples came in at or below that number. Regulators use the 90th percentile instead of an average because it’s more sensitive to the worst-affected homes rather than getting diluted by low readings elsewhere in the system. The federal action level under the Lead and Copper Rule is 15 parts per billion; if a system’s 90th percentile exceeds that, it triggers mandatory public notification and expanded treatment requirements. Michigan adopted a stricter statewide standard of 12 ppb that took effect in 2025, one of the tightest in the country.
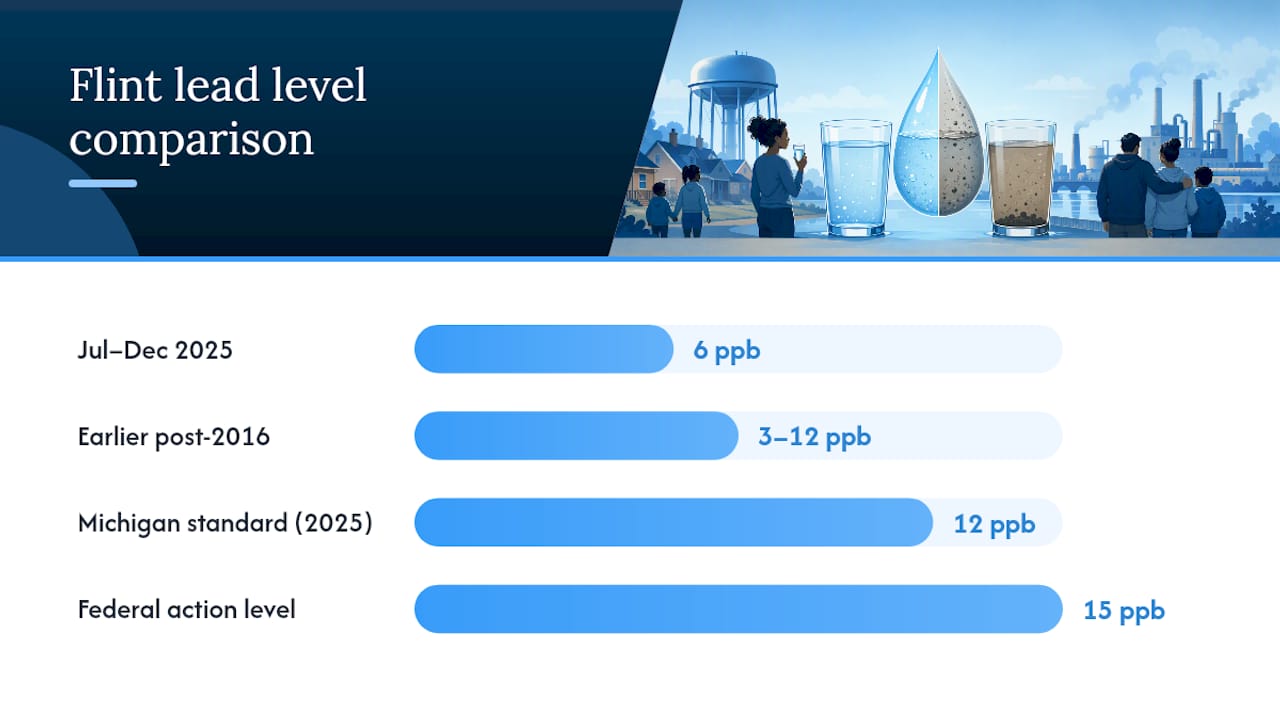
For the July to December 2025 monitoring period, Flint’s 90th-percentile result came in at 6 ppb, less than half the state’s tighter threshold. That’s the tenth consecutive year Flint has stayed under both benchmarks.
Here’s how recent monitoring periods compare, based on the state’s published six-month results:
| Monitoring Period | 90th Percentile (ppb) | Below Action Level? |
|---|---|---|
| July–Dec 2025 | 6 ppb | Yes (state and federal) |
| Jan–June 2025 | Reported in same monitoring series | Yes |
| Earlier post-2016 periods | Ranged roughly 3 to 12 ppb across cycles | Yes, consistently since July 2016 |
A few caveats matter before you treat “6 ppb” as the whole story:
- Sampling pools include a mix of high-risk homes with lead service lines; if the pool shifts to include more low-usage or nonresidential sites in a given cycle, the 90th percentile can swing lower or higher without reflecting a real change in pipe conditions citywide.
- Homes with older internal plumbing or partial lead service line replacements can still show elevated readings even when the city-wide number looks clean, because the number is a system-wide statistic, not a guarantee for any individual address.
- As of February 2026, the city estimates roughly 500 lead service lines still need replacement, meaning a meaningful share of homes remain a partial exception to the “problem solved” narrative.
If you want to see how Flint’s numbers stack up against other Michigan suppliers, or check lead data for your own address anywhere in the country, Tap Water Index’s Michigan lead report pulls directly from EPA monitoring records.
Legal Fallout: Charges, Settlements, and Accountability
Flint generated one of the largest public-corruption and environmental-liability legal sagas in recent American history, and it’s still not entirely closed.
- Criminal charges: Michigan’s Attorney General brought charges against numerous current and former officials, including two former governors’ cabinet appointees and city officials, on counts ranging from willful neglect of duty to involuntary manslaughter tied to the Legionnaires’ disease deaths.
- 2023 Michigan Supreme Court ruling: The state’s highest court dismissed felony charges against several defendants, ruling that the one-man grand jury process used to indict them was improper, a procedural setback rather than a finding on the underlying facts.
- Civil settlement: A $626 million settlement, funded jointly by the state, the city, a local hospital, and an engineering firm, was approved to compensate residents, with roughly 80% of funds directed toward claims involving children exposed as minors.
- Federal and state investigations: Multiple task forces and inspector-general style reviews concluded that regulatory failures spanned local, state, and federal levels, not any single rogue actor.
- Regulatory aftermath: The crisis directly shaped national Lead and Copper Rule revisions, pushing the EPA toward faster lead service line inventory requirements and, in Flint’s case specifically, Michigan’s own stricter 12 ppb action level.
If you’re trying to track a specific claim or court filing, the Michigan Attorney General’s press office publishes updates on prosecutions, and settlement administrator records remain the authoritative source for claim status, rather than secondhand summaries.
Replacing Flint’s Pipes: Where the Infrastructure Work Stands
The most visible recovery work in Flint has been underground, literally. Crews have excavated tens of thousands of service lines citywide since the replacement program ramped up under court-monitored settlement agreements, funded by a mix of state appropriations, federal infrastructure dollars, and settlement money earmarked specifically for pipe replacement and property restoration.
The remaining roughly 500 lines as of February 2026 represent the tail end of a program that started with an estimated pool many times that size. Progress has slowed as crews work through harder-to-locate lines, properties with access disputes, or homes where owners haven’t yet responded to notices scheduling excavation.
If you’re a Flint homeowner waiting on replacement, here’s what the process typically looks like: a crew excavates a section of your yard or the street near your water line, replaces the lead or galvanized pipe with copper, and then restores the yard, sidewalk, or road surface. Restoration doesn’t always happen immediately. It’s common for grass and landscaping repairs to lag weeks or months behind the actual pipe work, especially in winter months when planting isn’t practical.
Pro Tip: Keep your own paper trail. Save any notification letters about scheduled replacement, take before-and-after photos of your yard, and get a written confirmation once the new line is verified. If a contractor’s restoration work seems incomplete or damaged something on your property, a licensed local plumber can also verify the line material and connection quality independently, which is useful documentation if you ever need to dispute a claim. For emergency plumbing needs or verification work in the greater Detroit area, services like Sandison’s plumbing team can inspect line connections and confirm material composition.
Environmental Justice: Why Flint Became a National Symbol
Flint didn’t happen in a vacuum, and the demographics of who bore the exposure aren’t incidental to the story. The city is majority Black and one of Michigan’s poorest, and the emergency manager system that made the water-switch decision was itself a structure that stripped elected local officials of authority, replacing city council votes with a single state-appointed manager answerable to Lansing rather than Flint residents.
That governance arrangement matters because it removed the normal accountability loop. When residents complained about discolored, bad-smelling water starting in mid-2014, there was no local elected body empowered to override the emergency manager’s decisions. Complaints went to a state-appointed official whose mandate was balancing budgets, not fielding health concerns.
Task-force reviews and academic summaries have since concluded that a wealthier, whiter community would likely have received a faster, more credible response. Britannica’s historical summary of the crisis frames it directly as a case where race and poverty shaped both the initial decision and the sluggish institutional response once problems surfaced. The pattern researchers point to isn’t unique to Flint: emergency management structures in Michigan disproportionately governed majority-Black cities in the years leading up to 2014, a fact environmental justice scholars cite as evidence the crisis reflected a broader pattern rather than a one-off failure.
The social scar tissue outlasted the chemistry. Years after the water tested clean, surveys of Flint residents have documented lasting distrust in government messaging about water safety, along with elevated rates of anxiety and depression tied directly to the crisis experience. Rebuilding that trust has meant more than fixing pipes. It has required consistent, independently verifiable reporting, which is part of why transparent, third-party-accessible monitoring data matters so much to this community specifically.
A Practical Checklist for Concerned Residents
Whether you live in Flint, elsewhere in Michigan, or anywhere with older housing stock, here’s a concrete sequence for managing lead risk in your own water.
- Check your service line material. Many utilities now maintain public service line inventories; contact your local water utility or check your city’s records to see if your home connects via lead or galvanized pipe.
- Test your water if you’re unsure. Home test kits exist, but a laboratory test through your utility or an accredited lab gives more reliable results than at-home strips.
- Install a certified filter if lead is present or suspected. Look for filters certified to NSF/ANSI Standard 53 for lead reduction, not just general filtration standards.
- Replace filter cartridges on schedule. A lead filter past its rated capacity stops protecting you and can even start releasing trapped contaminants back into the water.
- Use bottled or filtered water for infant formula preparation if advised. Pediatric guidance during active advisories typically recommends this for babies under six months.
- Get blood-lead testing for children under six, especially in older housing. Pediatricians in high-risk areas often recommend a baseline test around age one and two.
A few more items worth keeping on hand:
- Save your utility’s Consumer Confidence Report, the annual water quality summary every public system is required to publish.
- Know your state’s blood-lead testing requirements; some states mandate testing at specific ages for children on Medicaid.
- Keep contact information for your local health department handy in case you need referral to case management or remediation resources.
- If you believe you were exposed during the Flint crisis specifically, settlement claim deadlines and documentation requirements are handled through the court-appointed claims administrator, not the city directly.
How to Check Current Flint Water Data Using Tap Water Index
Reading a water quality report shouldn’t require a chemistry degree. Here’s a straightforward process for pulling current numbers yourself.
- Locate the lead results section. Look for the 90th-percentile value and the date range it covers; a credible report always states both, since a number without a monitoring period is meaningless.
- Compare the result against the action levels. Federal action level is 15 ppb; Michigan’s statewide standard is 12 ppb as of 2025. Anything below both means the system is currently compliant.
- Cross-reference with the official monitoring page. For Flint specifically, Michigan’s own six-month monitoring results page publishes the historical series directly from EGLE, useful for spotting whether a number represents a trend or an anomaly.
- Check for press releases around unusual results. A sudden spike or a milestone announcement, like the 10th year of compliance update, usually comes with agency context explaining what changed.
Tap Water Index builds its reports directly from EPA monitoring submissions, which means you’re seeing the same underlying data regulators use rather than a summary filtered through a utility’s own press office. That’s particularly useful if you’re comparing multiple monitoring periods to see whether a city’s numbers are improving, worsening, or just bouncing around within normal variation, whether that’s Michigan, Illinois, or any other state.
Pro Tip: Pay attention to the difference between a raw sample collection date and a “reporting period” label. A monitoring cycle covers six months, but the individual samples inside it were collected on different days, sometimes clustered early in the window. If a period’s 90th percentile looks unusually low, check whether the sampling pool that cycle leaned heavily on nonresidential or low-usage sites, which can pull the statistic down without reflecting conditions in high-risk homes.
Reading Water Quality Data Without Getting Misled
A little vocabulary goes a long way toward asking the right questions when a city, a utility, or a news article throws numbers at you.
- 90th percentile: The value at which 90% of tested samples fall at or below; regulators use this instead of an average specifically because it highlights the worst-case homes rather than smoothing them out.
- Action level: The threshold that triggers mandatory public notification and treatment response, 15 ppb federally, 12 ppb in Michigan as of 2025.
- Detection limit: The smallest concentration a lab’s equipment can reliably measure; results below this are typically reported as “non-detect” rather than zero.
- Tier 1 vs. Tier 2 sampling: Tier 1 sites are the highest-risk homes (known lead service lines or lead solder plumbing) that utilities must prioritize for testing; Tier 2 sites are used only if Tier 1 pools are too small.
- First-draw vs. sequential samples: A first-draw sample is water that’s sat in the pipe overnight, capturing peak lead exposure; sequential sampling takes multiple draws in sequence to identify exactly where in the plumbing the lead is coming from.
Watch for these red flags when a report doesn’t add up:
- A large, unexplained jump or drop in the 90th percentile between consecutive monitoring periods with no accompanying explanation.
- Sampling methodology that changed between reporting cycles without disclosure, since that alone can shift results independent of actual water quality.
- A sampling pool weighted toward nonresidential or low-usage sites, which historically produce lower readings than high-risk homes with lead service lines. Community-driven, independent sampling in Flint specifically helped expose testing protocols like pre-flushing taps before collection, a practice that can artificially depress lead readings compared to a true first-draw sample.
If a report seems inconsistent with what you’re experiencing, EGLE (Michigan’s environmental regulator), your water utility’s customer service line, and your county or city health department are the three places to ask for clarification, and you can request the underlying sample-level data rather than just the summary statistic.
Tracking Flint’s Long-Term Health Outcomes
The crisis didn’t end when the water tested clean. Public-health researchers have kept following Flint residents for years afterward, and that ongoing surveillance is arguably as important as the initial emergency response.
A coordinated public-health response and recovery initiative documented how multiple agencies, including state health departments, local hospitals, and academic partners, built out long-term monitoring infrastructure specifically because a single blood-lead test can’t capture the full picture of exposure or its downstream effects. Children exposed during the highest-risk window are now old enough that researchers are tracking school performance, behavioral health referrals, and developmental screening outcomes, comparing Flint cohorts against similar Michigan cities that weren’t exposed.

Peer-reviewed analyses have also examined broader population health signals tied to the water switch, including the fertility and birth outcome data researchers flagged in the years immediately following the crisis, and continued surveillance for Legionnaires’ disease patterns connected to the same treatment failures. This kind of longitudinal tracking is slow, methodologically careful work. It doesn’t produce a single headline number the way a 90th-percentile lead result does, but it’s what will eventually tell us the true long-term cost of those 18 months.
Did Bottled Water and Filters Actually Solve the Problem?
During the height of the crisis, the state and National Guard distributed bottled water and filter cartridges to Flint households, a stopgap that raised its own adequacy questions.
Bottled water worked as an immediate substitute for drinking and cooking, but it created real logistical burdens: households without reliable transportation struggled to collect distribution-site allotments, and elderly or disabled residents often depended on volunteers to bring cases to their doors. It also didn’t address bathing or showering, where lead exposure risk is lower but not zero, particularly for young children who might swallow bathwater.
Filters distributed by the state were certified for lead reduction, but effectiveness depended entirely on correct installation and consistent cartridge replacement, and initial guidance about which filters worked at Flint’s higher contamination levels shifted as officials learned some models weren’t rated for the concentrations found in the worst-affected homes. Some residents also distrusted filters entirely after a year of being told the water was safe when it wasn’t, which meant public health messaging had to work as hard as the engineering fix itself. The lesson for anyone facing a water emergency today: verify your filter’s specific NSF certification against your actual contamination level, don’t assume any filter labeled “for drinking water” is adequate for lead removal, and treat bottled water distribution logistics as a real access problem, not just a supply problem.
Why Flint Still Matters for National Water Policy
Flint changed how I think about water safety reporting, and it should change how you read any city’s compliance numbers. A “safe” result today doesn’t erase eighteen months of governance failure, and it doesn’t replace the roughly 500 pipes still waiting underground. What Flint proved is that a functioning early-warning system depends on independent testing and people willing to publish results that contradict official reassurance, not on waiting for an agency to announce a problem on its own timeline.
If you want to know what’s actually running through your tap, don’t take a headline number on faith. Search your own city, ZIP code, or utility on Tap Water Index and look at the underlying EPA monitoring data yourself.
Sources
- Flint water enters 10th year of lead testing compliance
- Six-month lead and copper monitoring results in Flint, Michigan
- The Flint Water Crisis: A Coordinated Public Health Emergency Response and Recovery Initiative
- Story: Flint Water Crisis | CASPER
- LCRI fact sheet for the public (EPA)
This article is general information, not a substitute for advice from a qualified doctor. Consult a qualified healthcare professional about your own circumstances before acting on anything here.